Appearance
Chat BI Cases
This article is about the specific cases of ChatBI usage, mainly including: Single Question, Multiple issues, Cube association, etc.
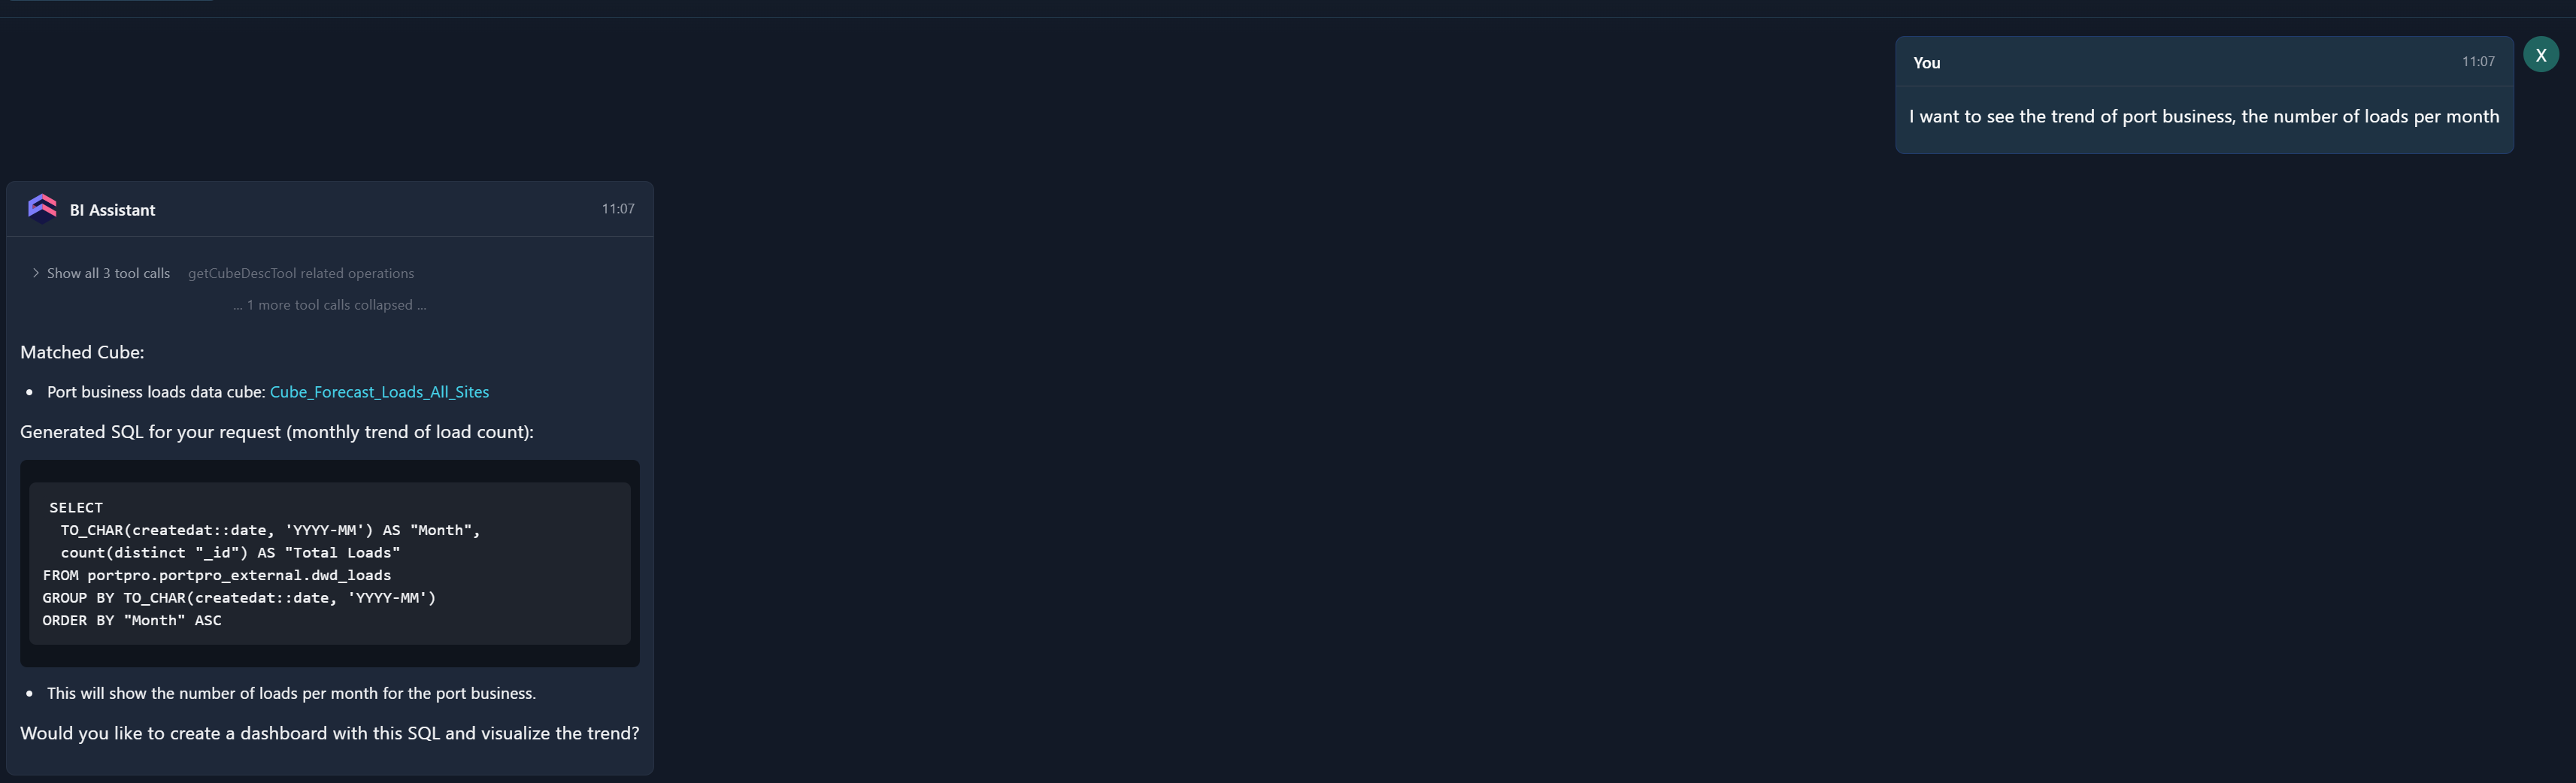
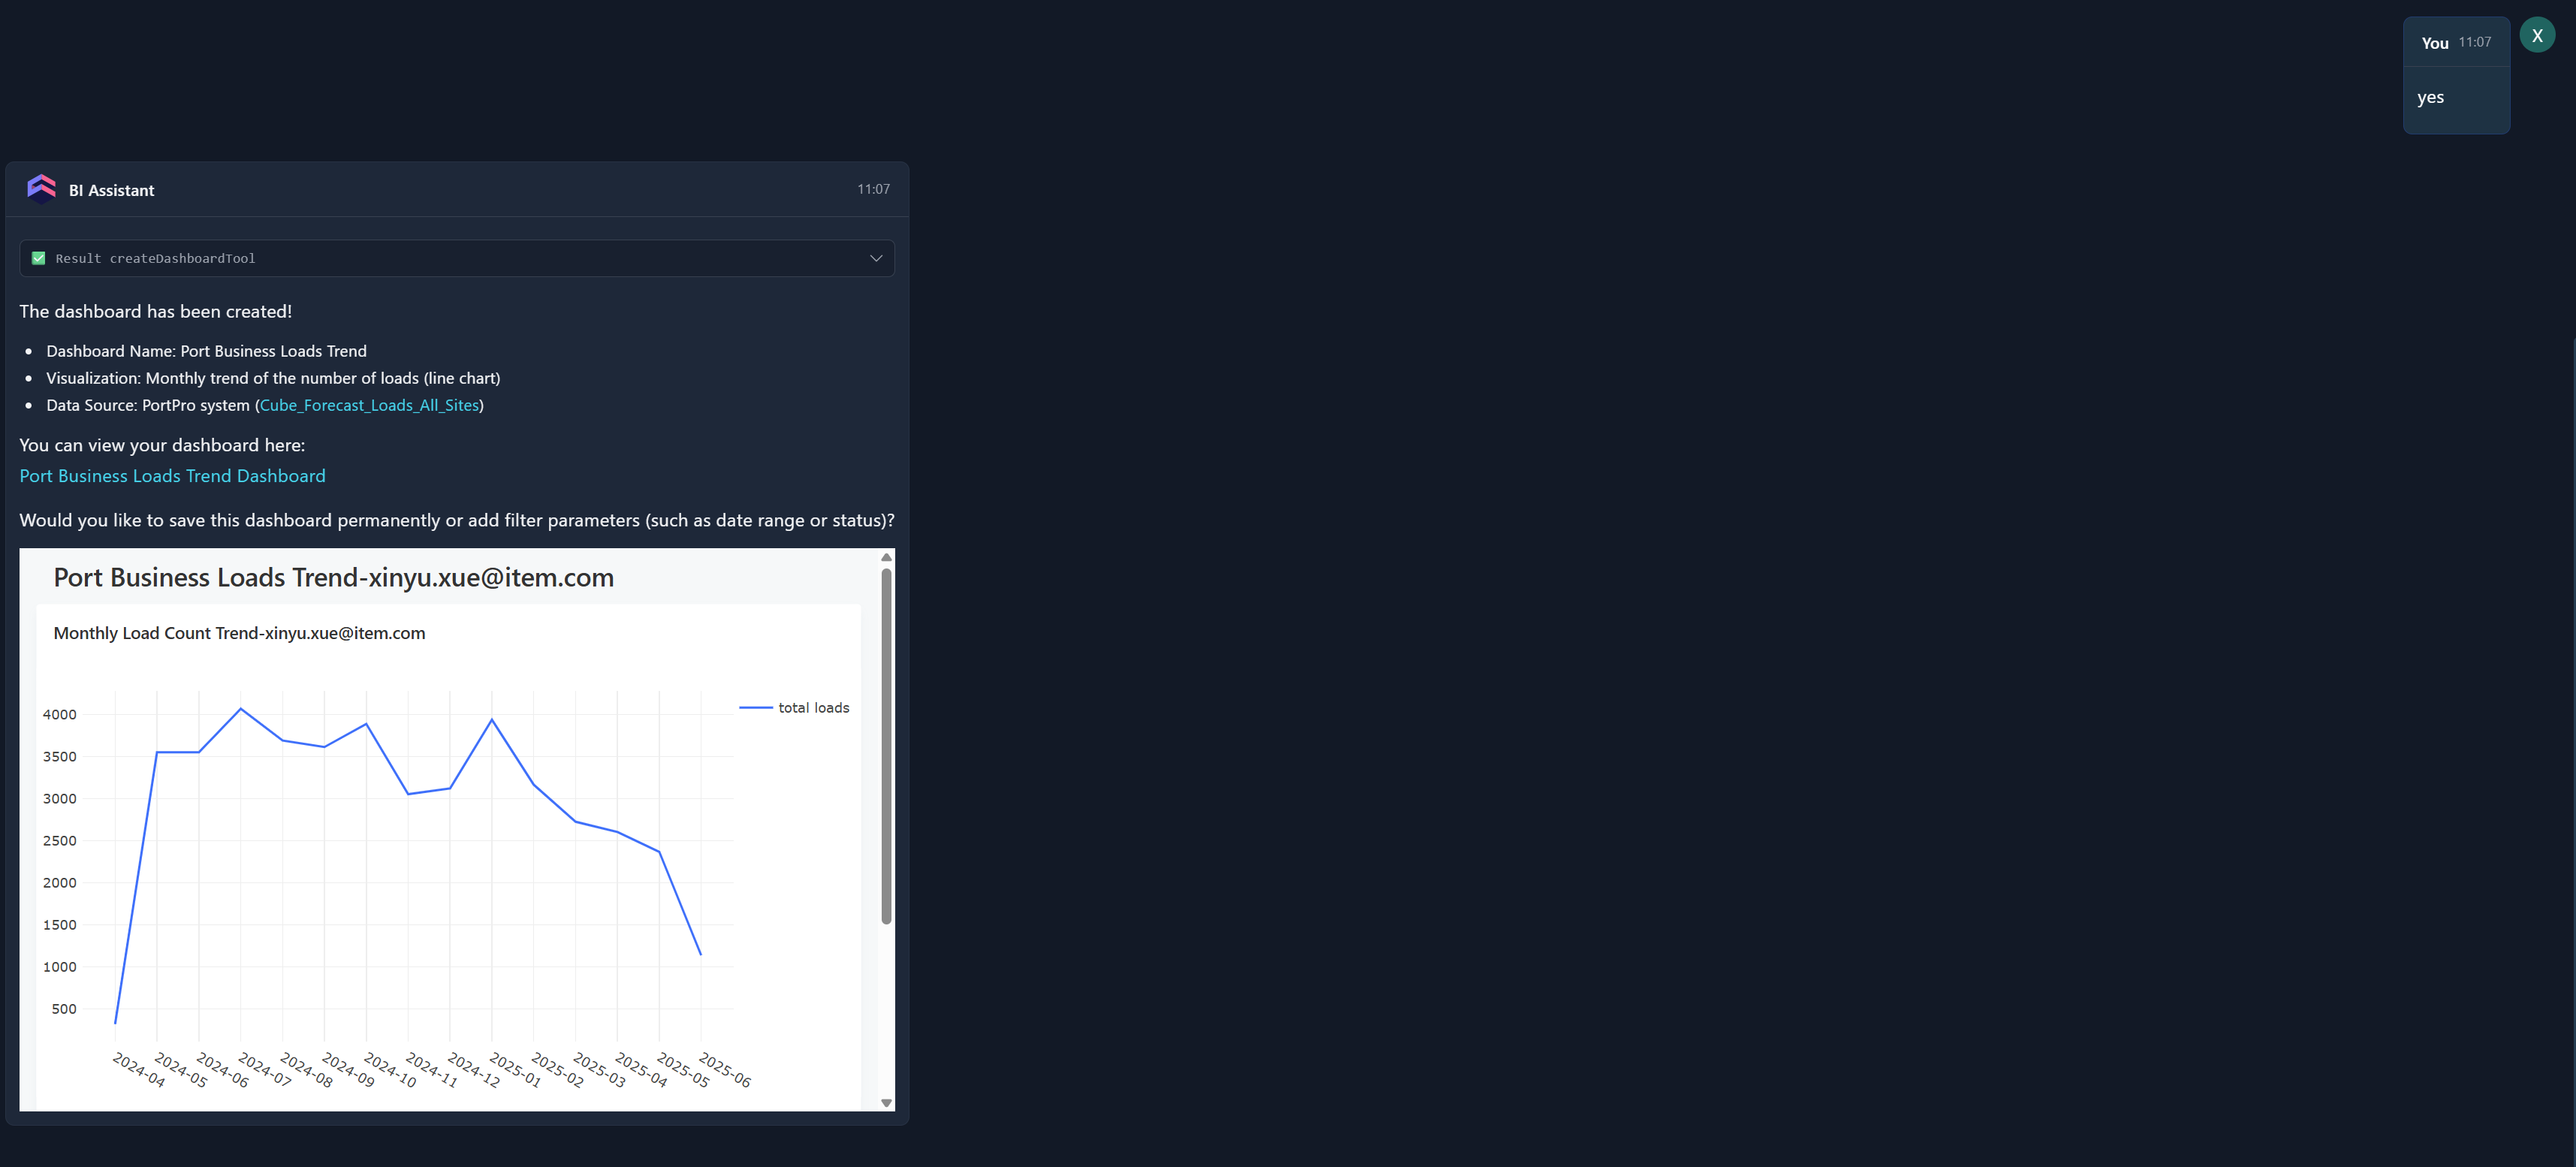
1 Single Question
Q: I want to see the trend of port business, the number of loads per month
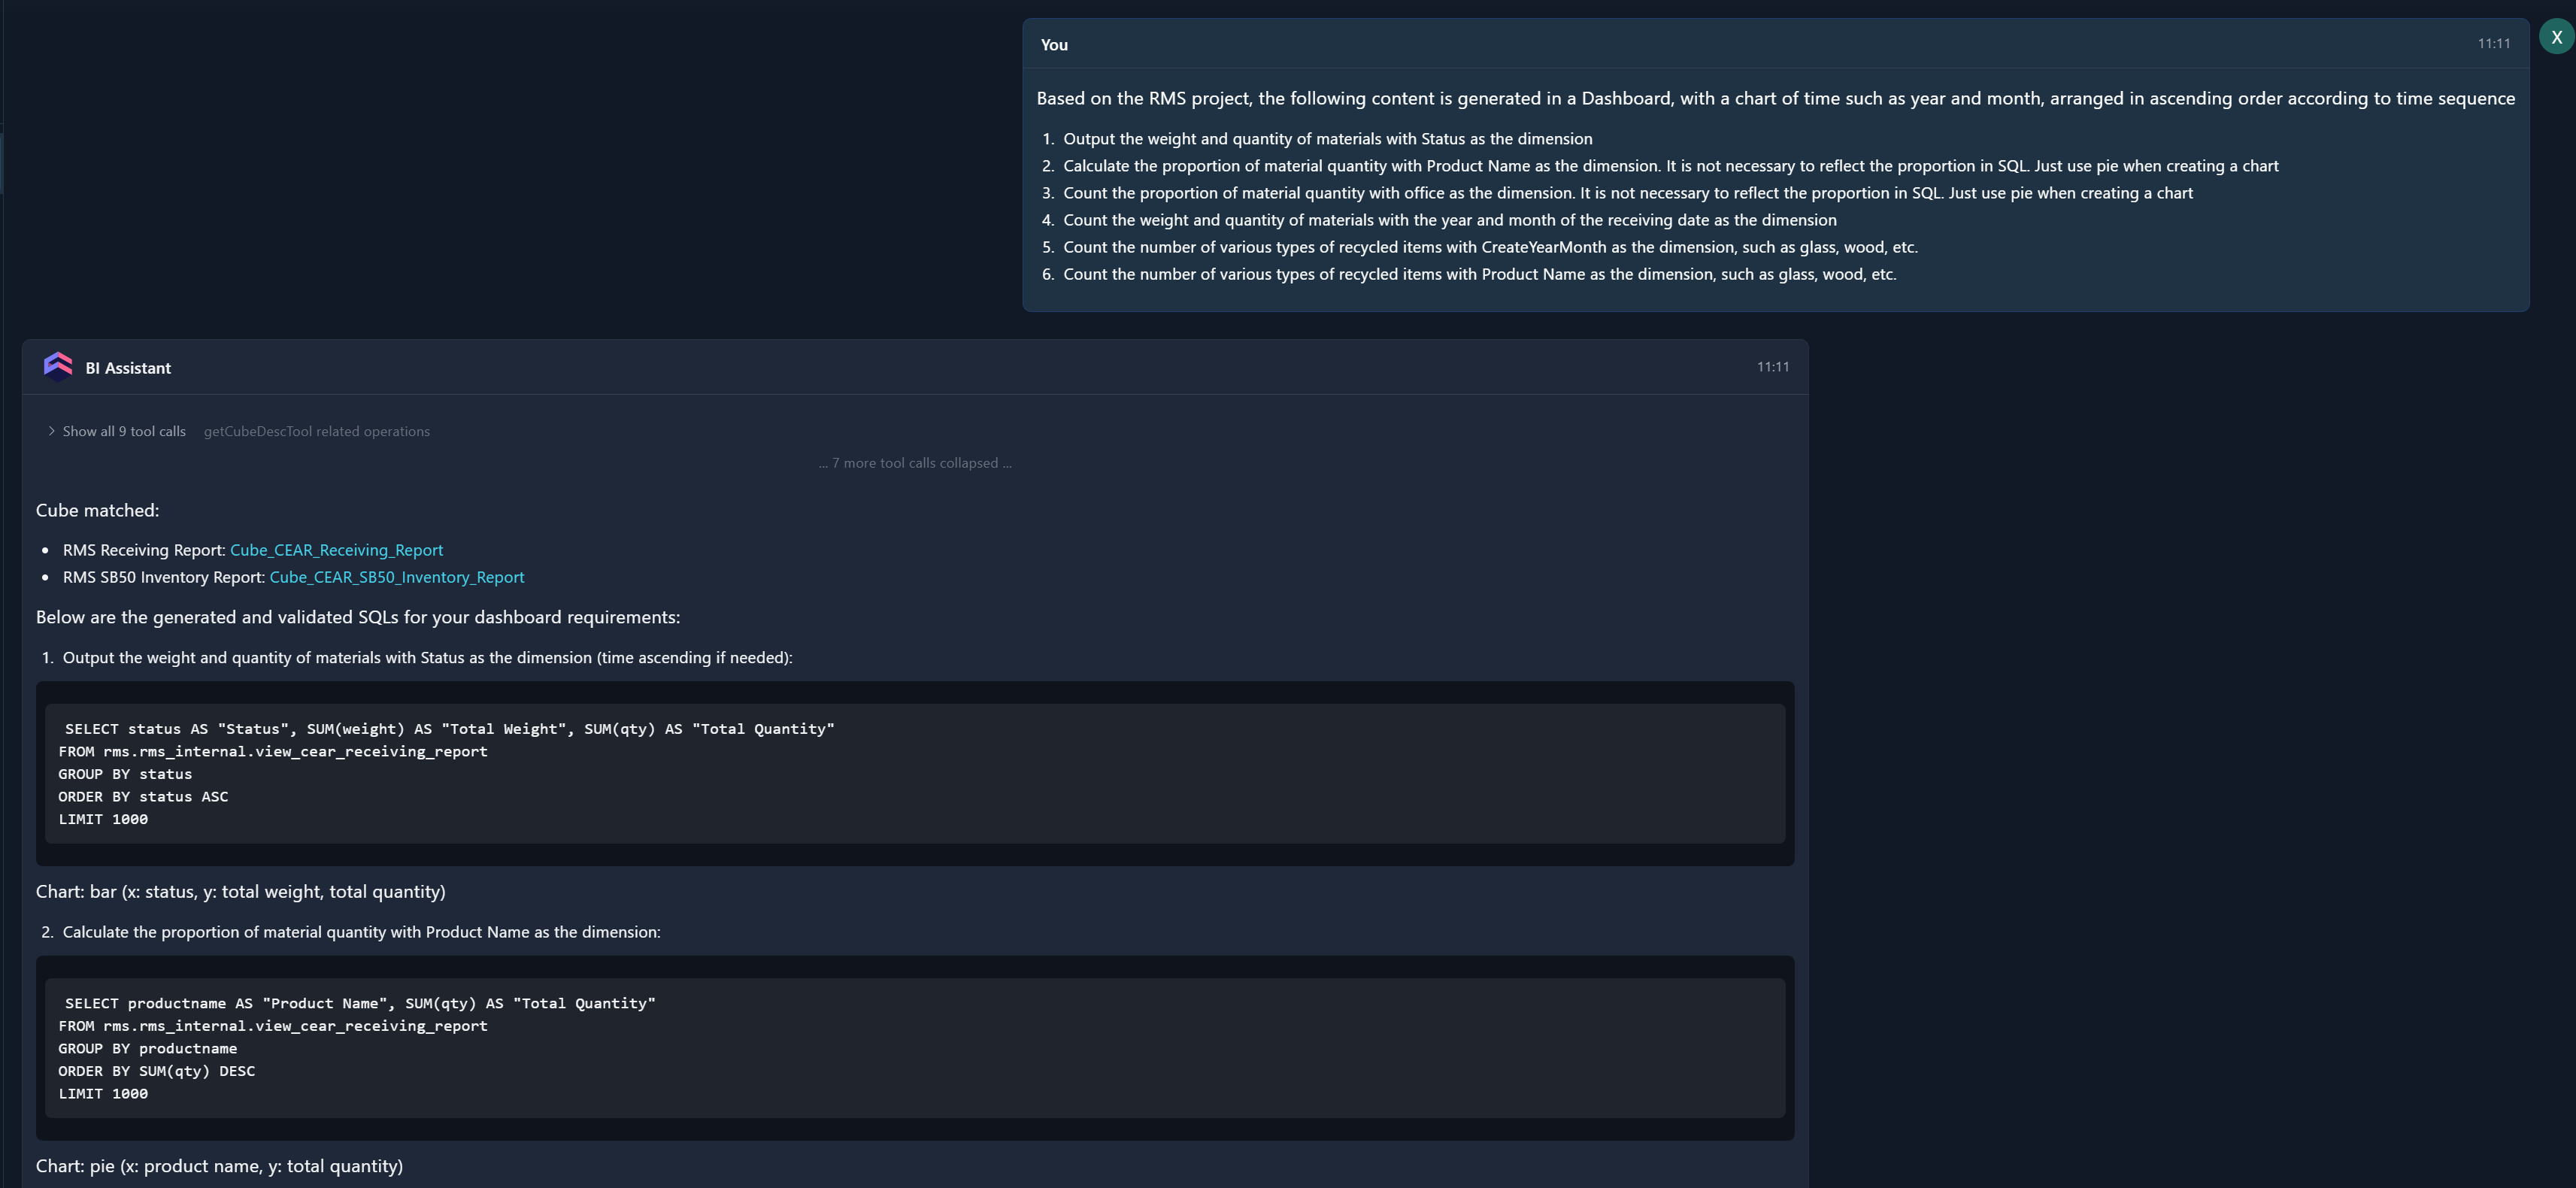
2 Multiple issues
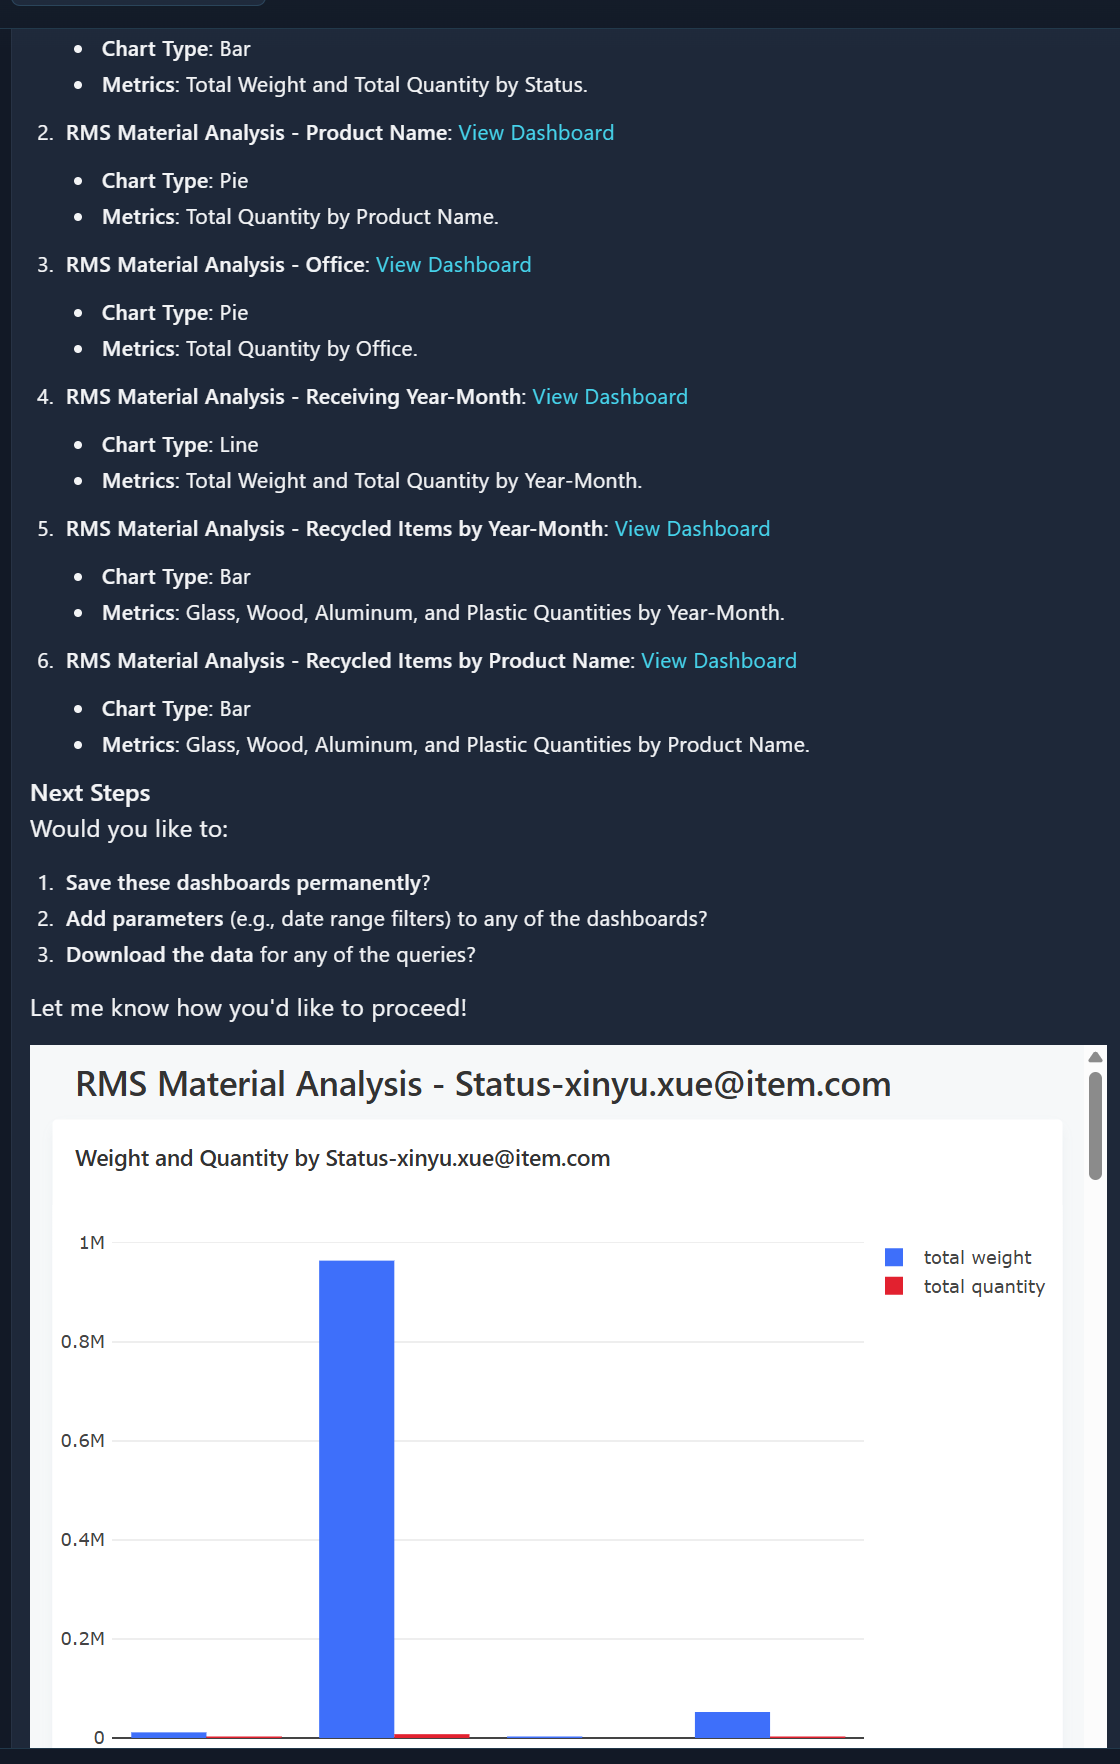
Q: Based on the RMS project, the following content is generated in a Dashboard, with a chart of time such as year and month, arranged in ascending order according to time sequence
- Output the weight and quantity of materials with Status as the dimension
- Calculate the proportion of material quantity with Product Name as the dimension. It is not necessary to reflect the proportion in SQL. Just use pie when creating a chart
- Count the proportion of material quantity with office as the dimension. It is not necessary to reflect the proportion in SQL. Just use pie when creating a chart
- Count the weight and quantity of materials with the year and month of the receiving date as the dimension
- Count the number of various types of recycled items with CreateYearMonth as the dimension, such as glass, wood, etc.
- Count the number of various types of recycled items with Product Name as the dimension, such as glass, wood, etc.
3 Cube association
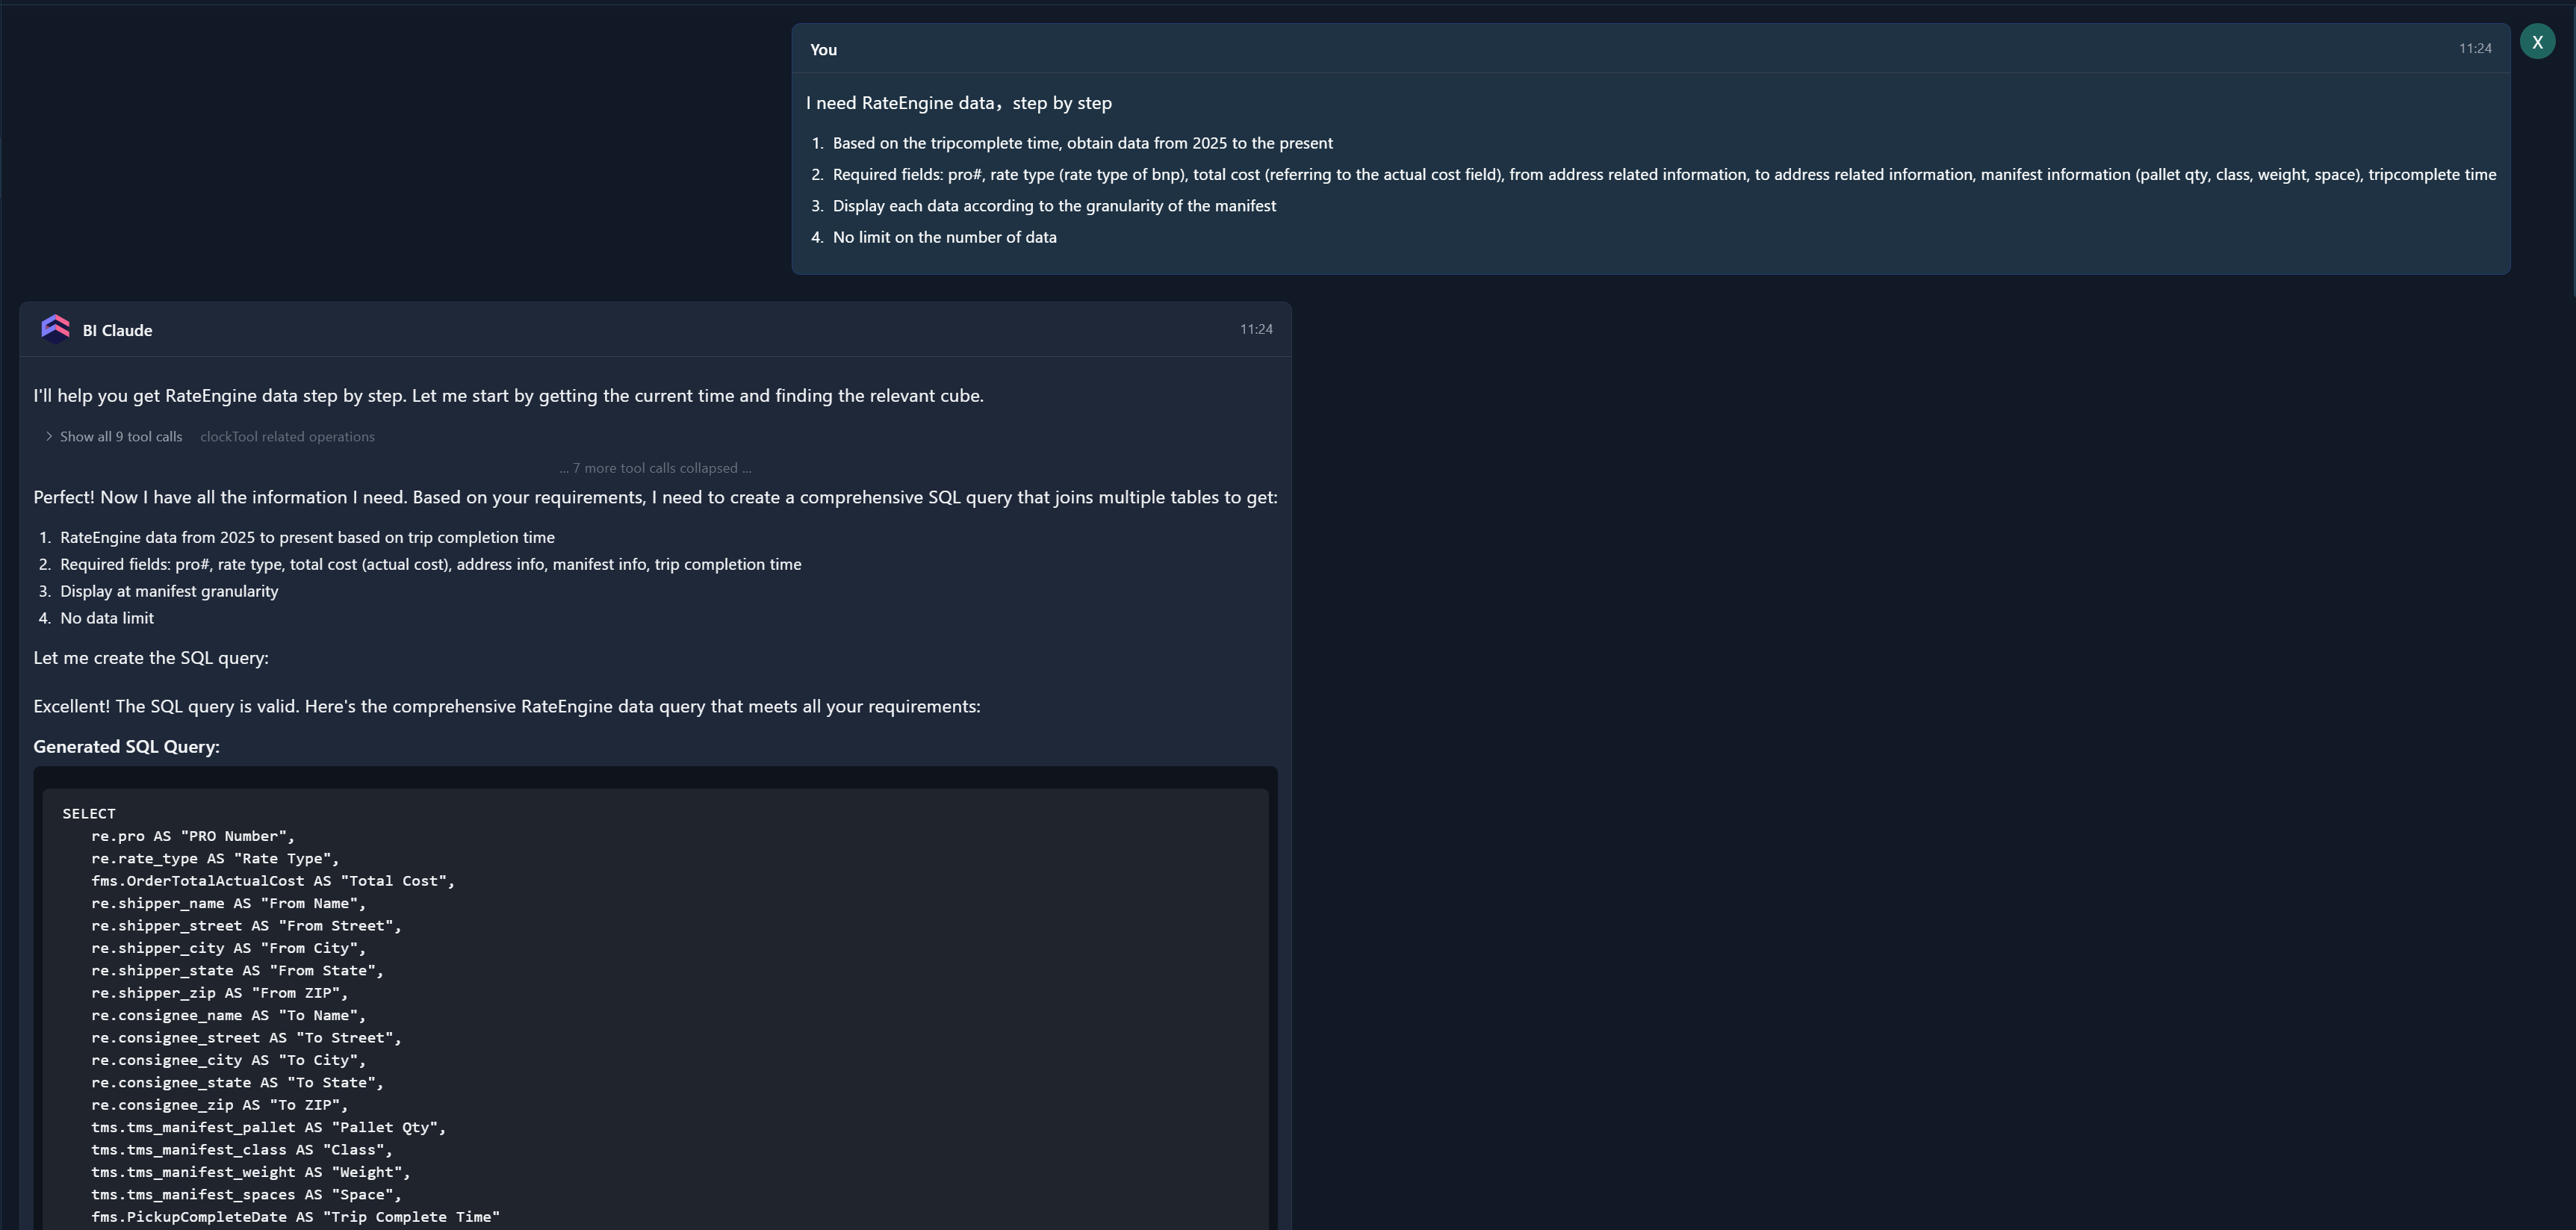
Q: I need RateEngine data,step by step
- Based on the tripcomplete time, obtain data from 2025 to the present
- Required fields: pro#, rate type (rate type of bnp), total cost (referring to the actual cost field), from address related information, to address related information, manifest information (pallet qty, class, weight, space), tripcomplete time
- Display each data according to the granularity of the manifest
- No limit on the number of data
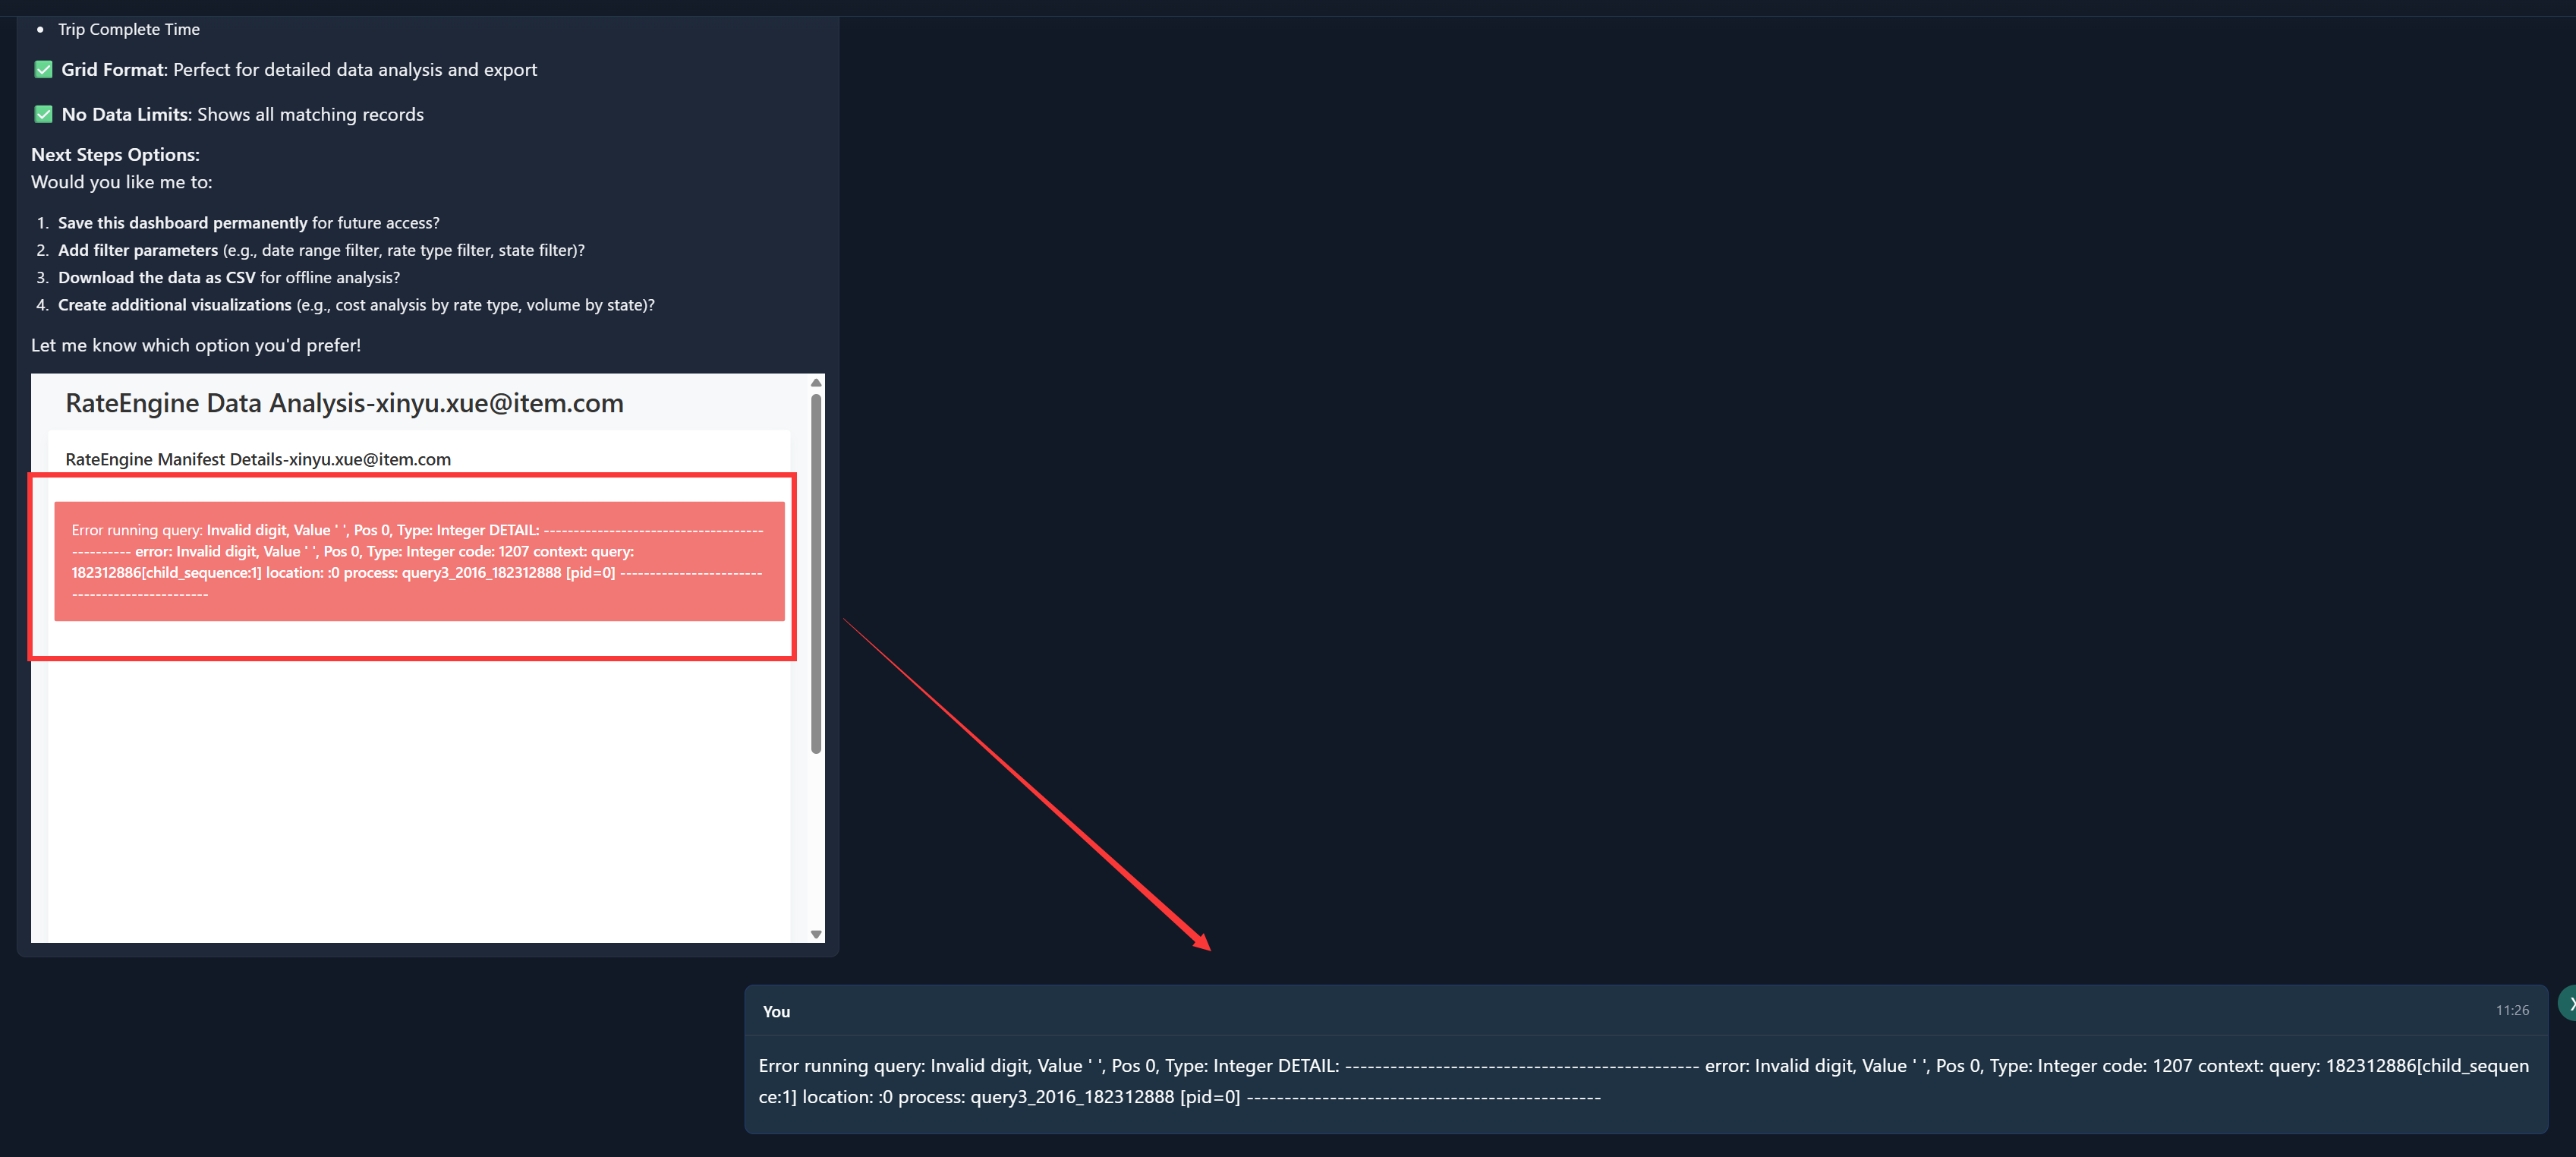
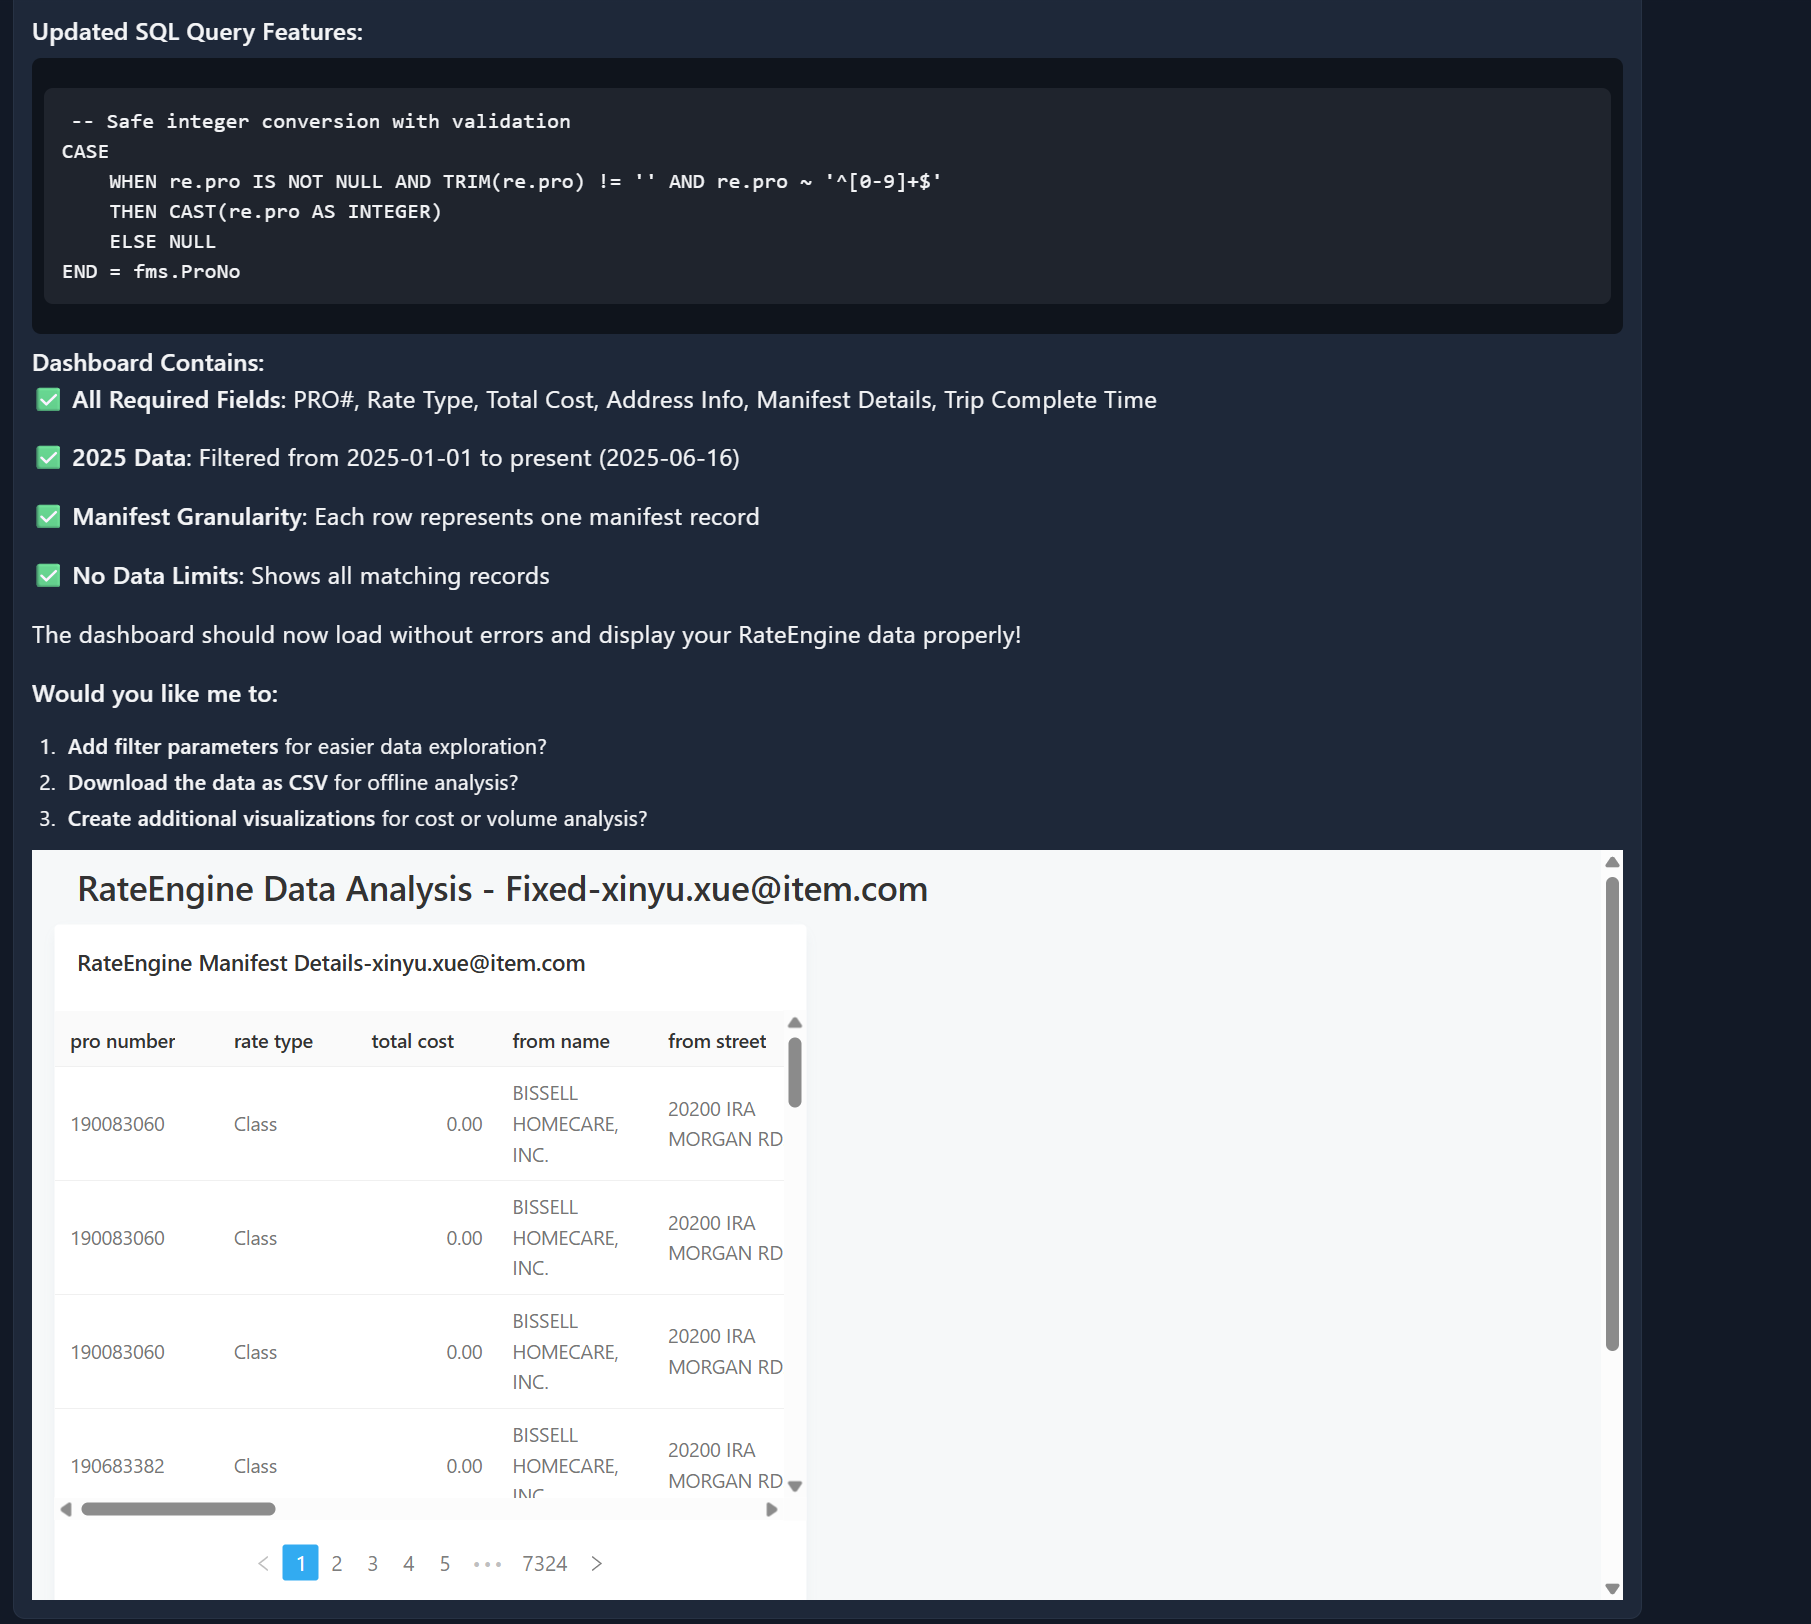
- If you encounter an error during the creation process, copy the error and send it to the big model, it will automatically correct it
4 Save As
Q: Please save the board
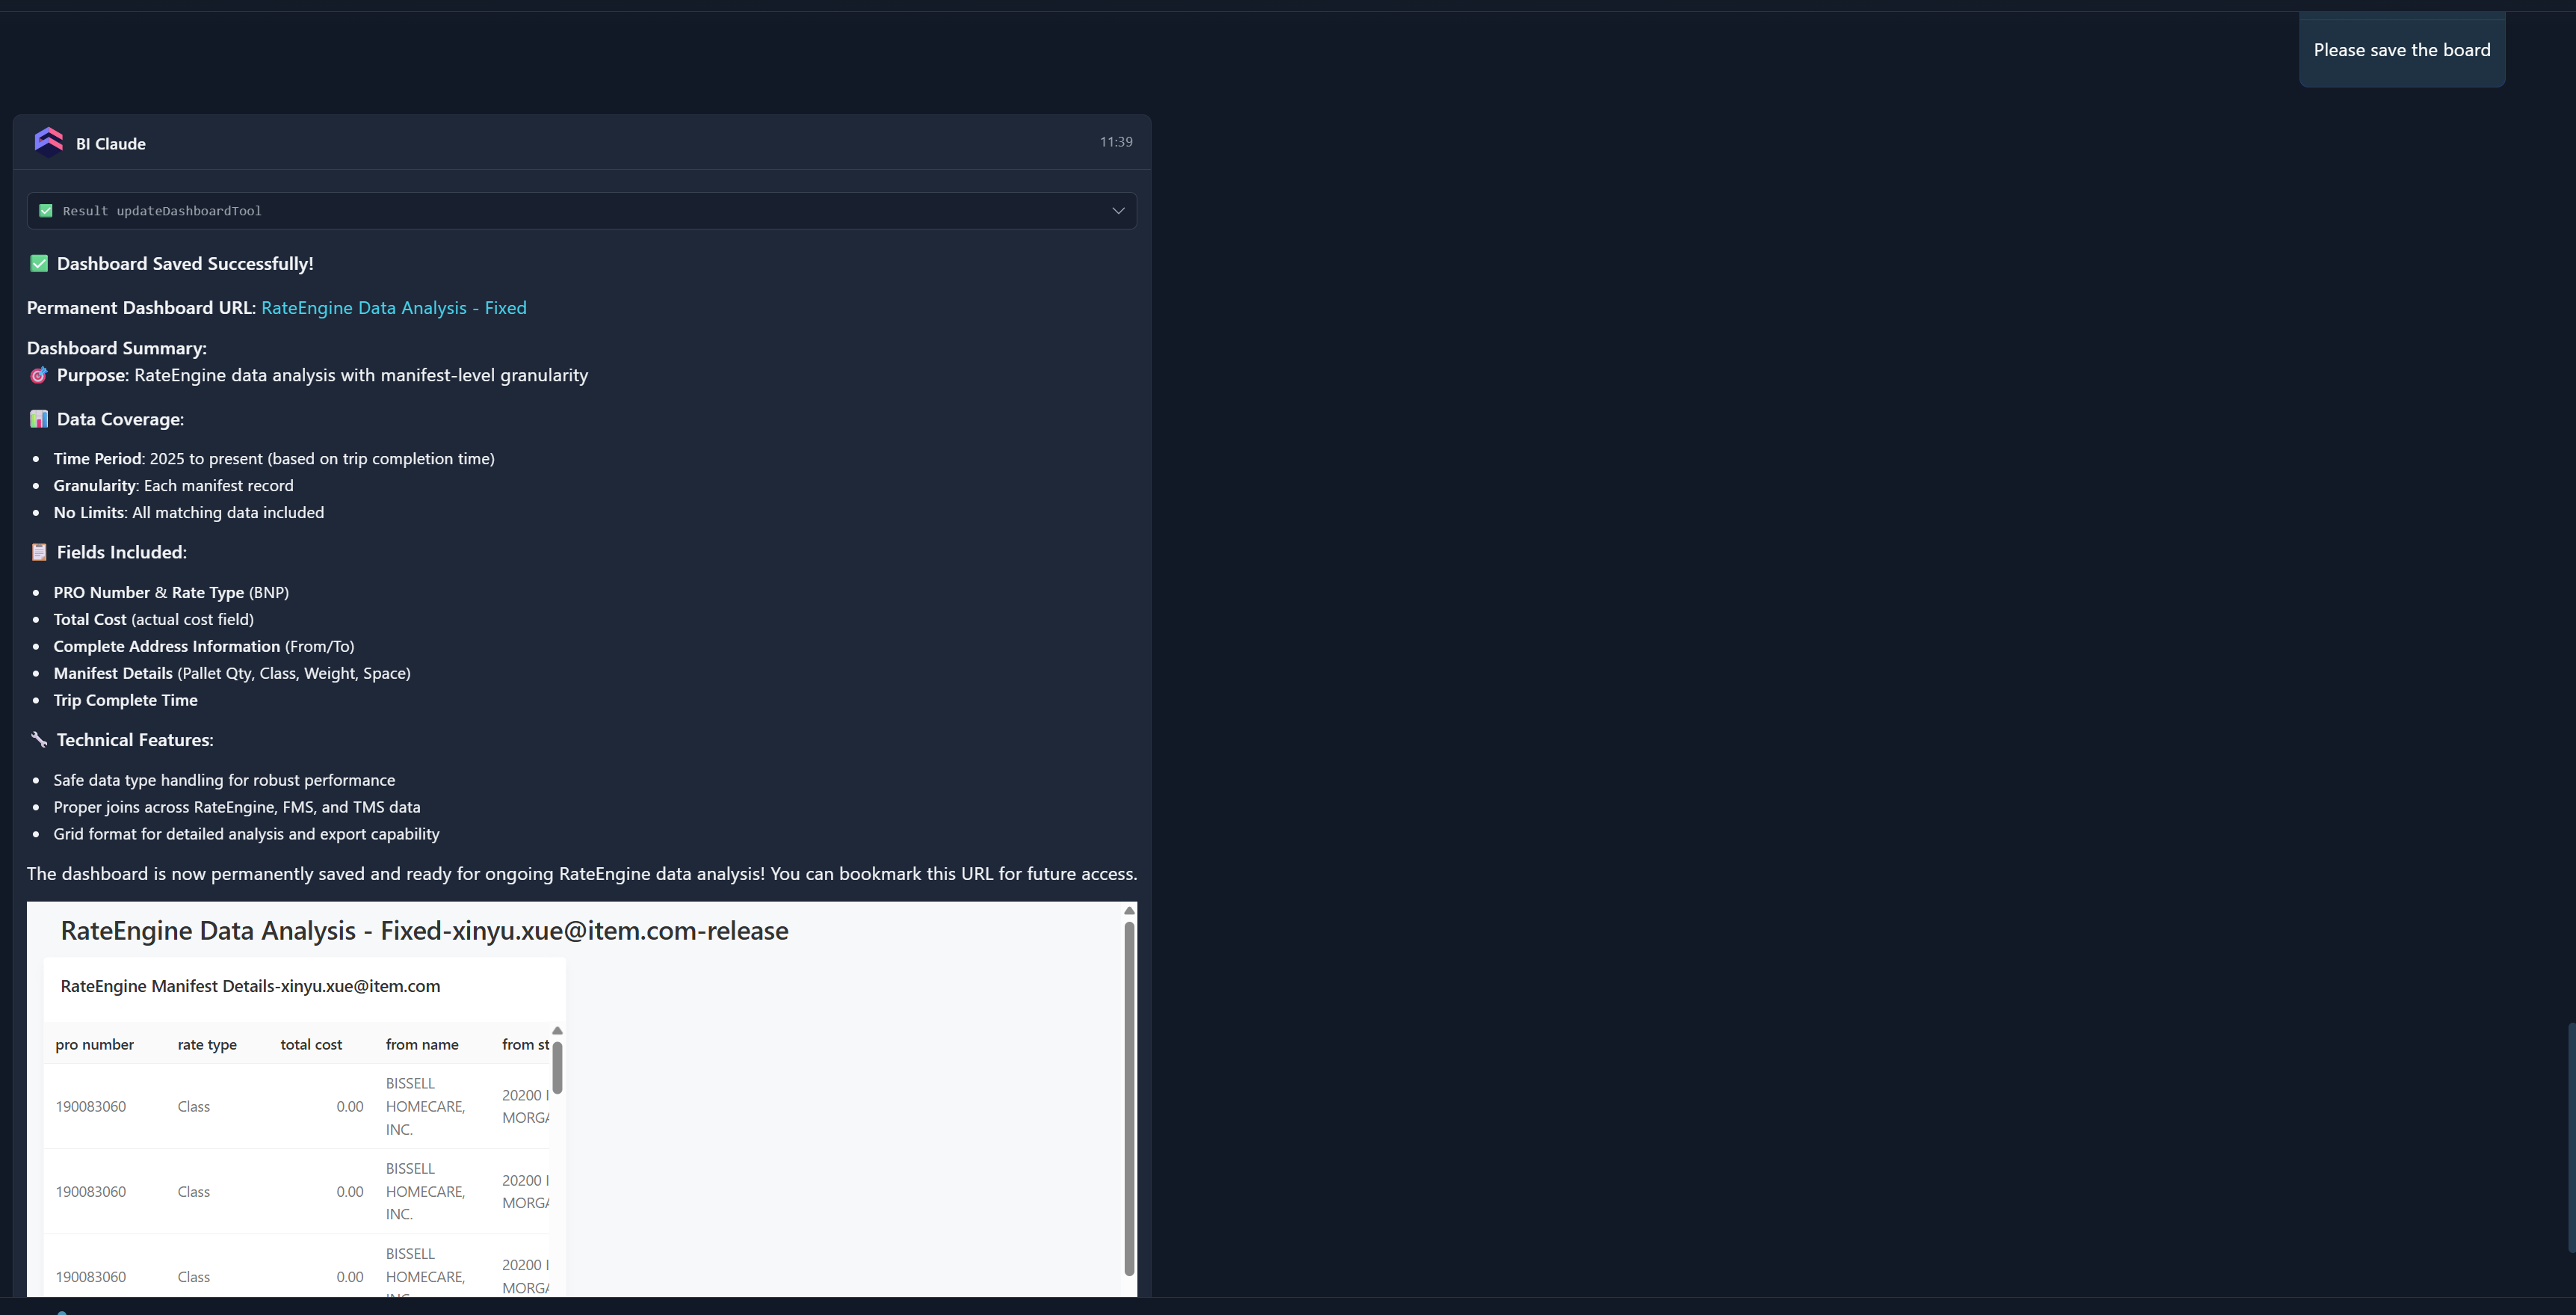
- Issue a save command, AI will save the dashboard, and you can log in to the cube system to view it
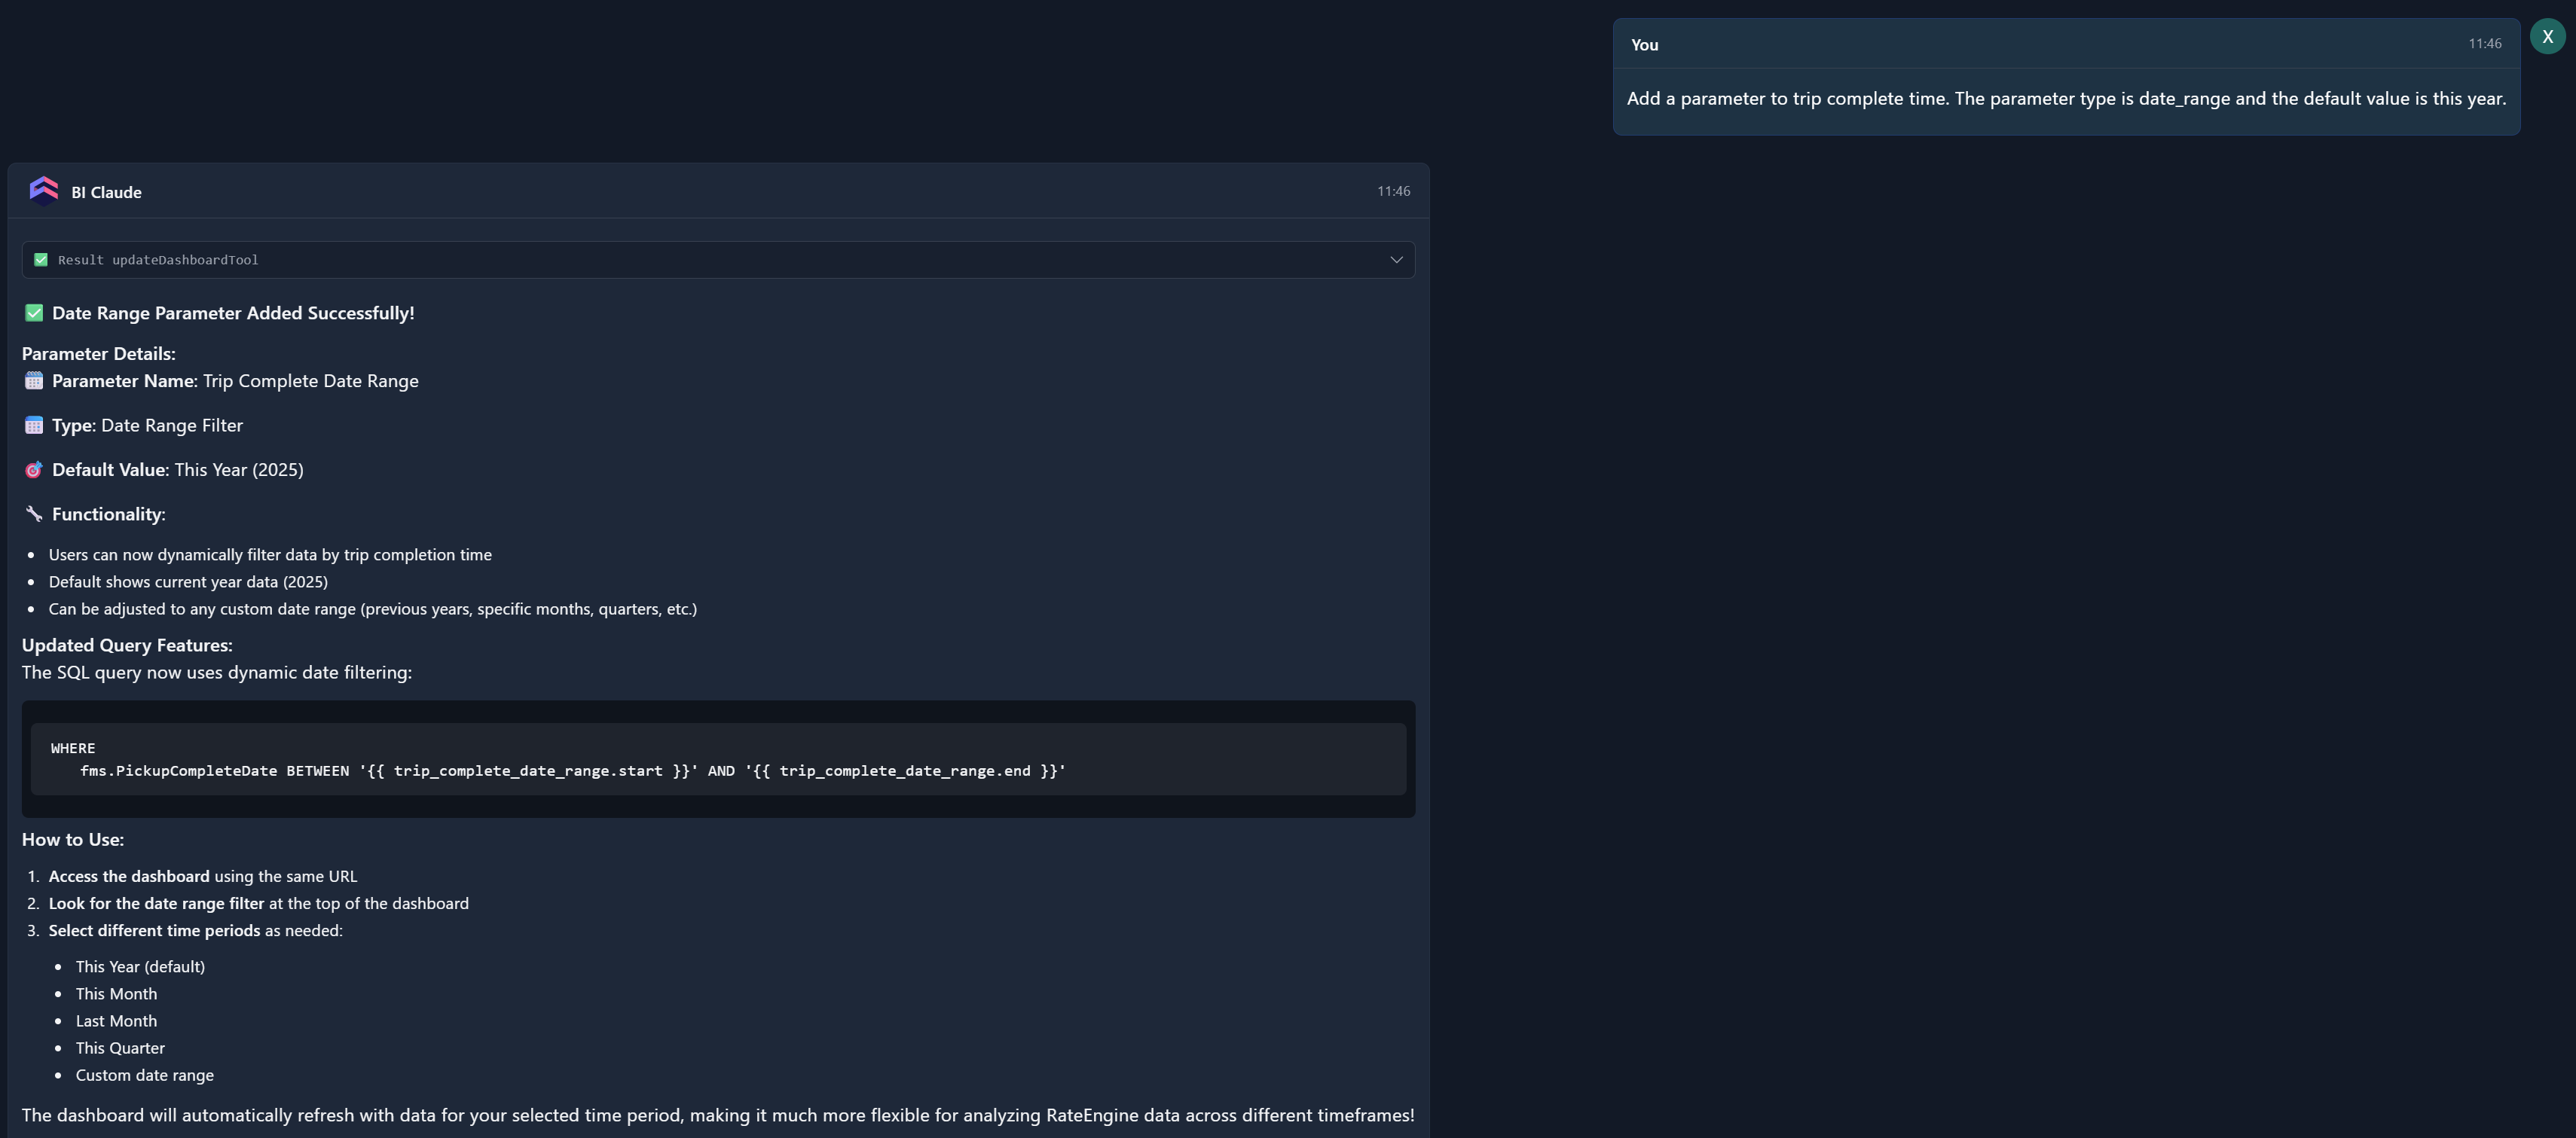
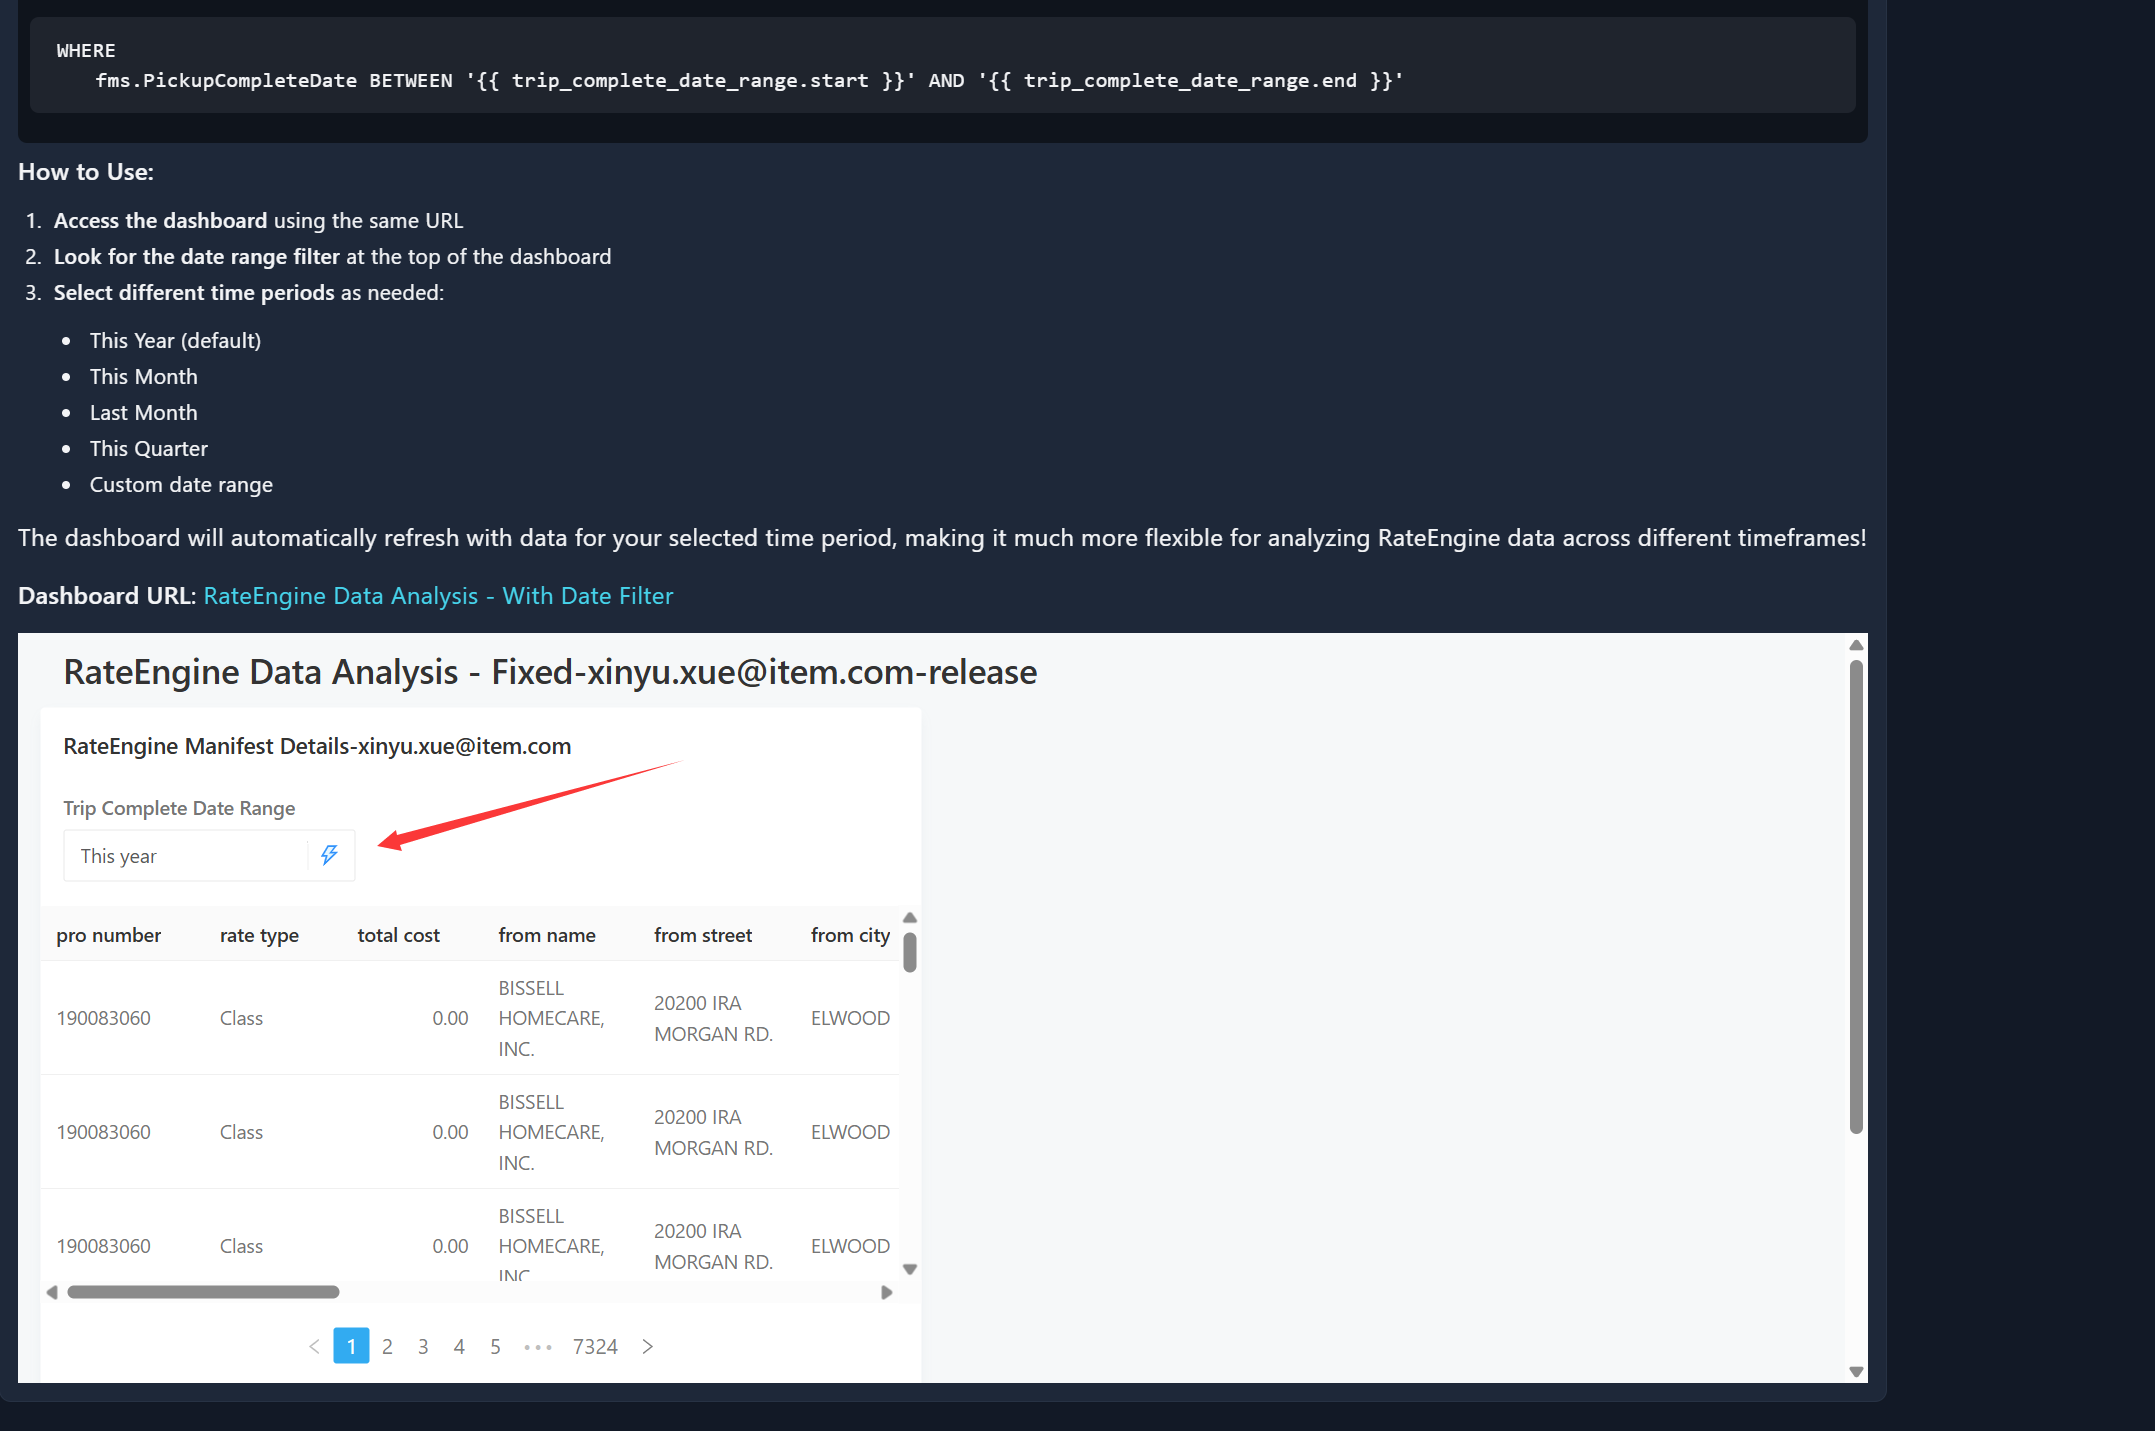
5 Add parameters
Q: Add a parameter to trip complete time. The parameter type is date_range and the default value is this year.
6 Generate a dashboard based on uploaded images
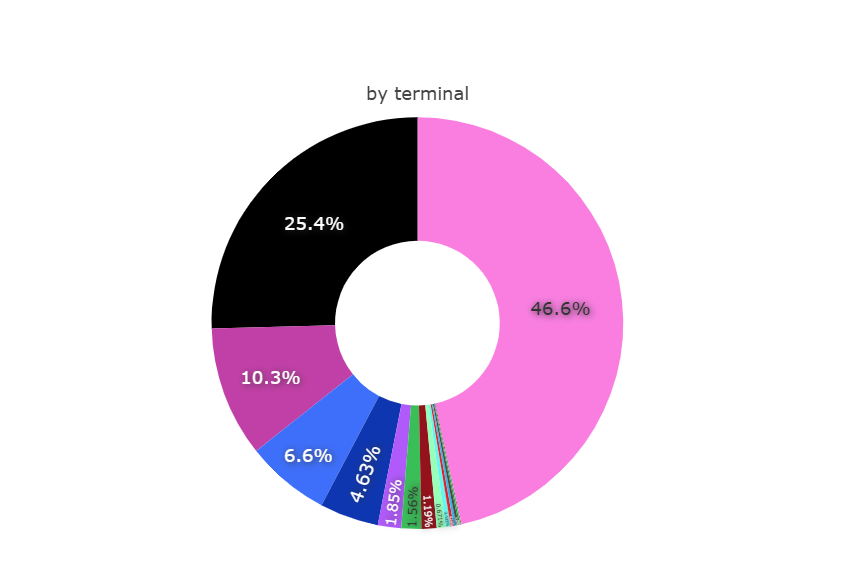
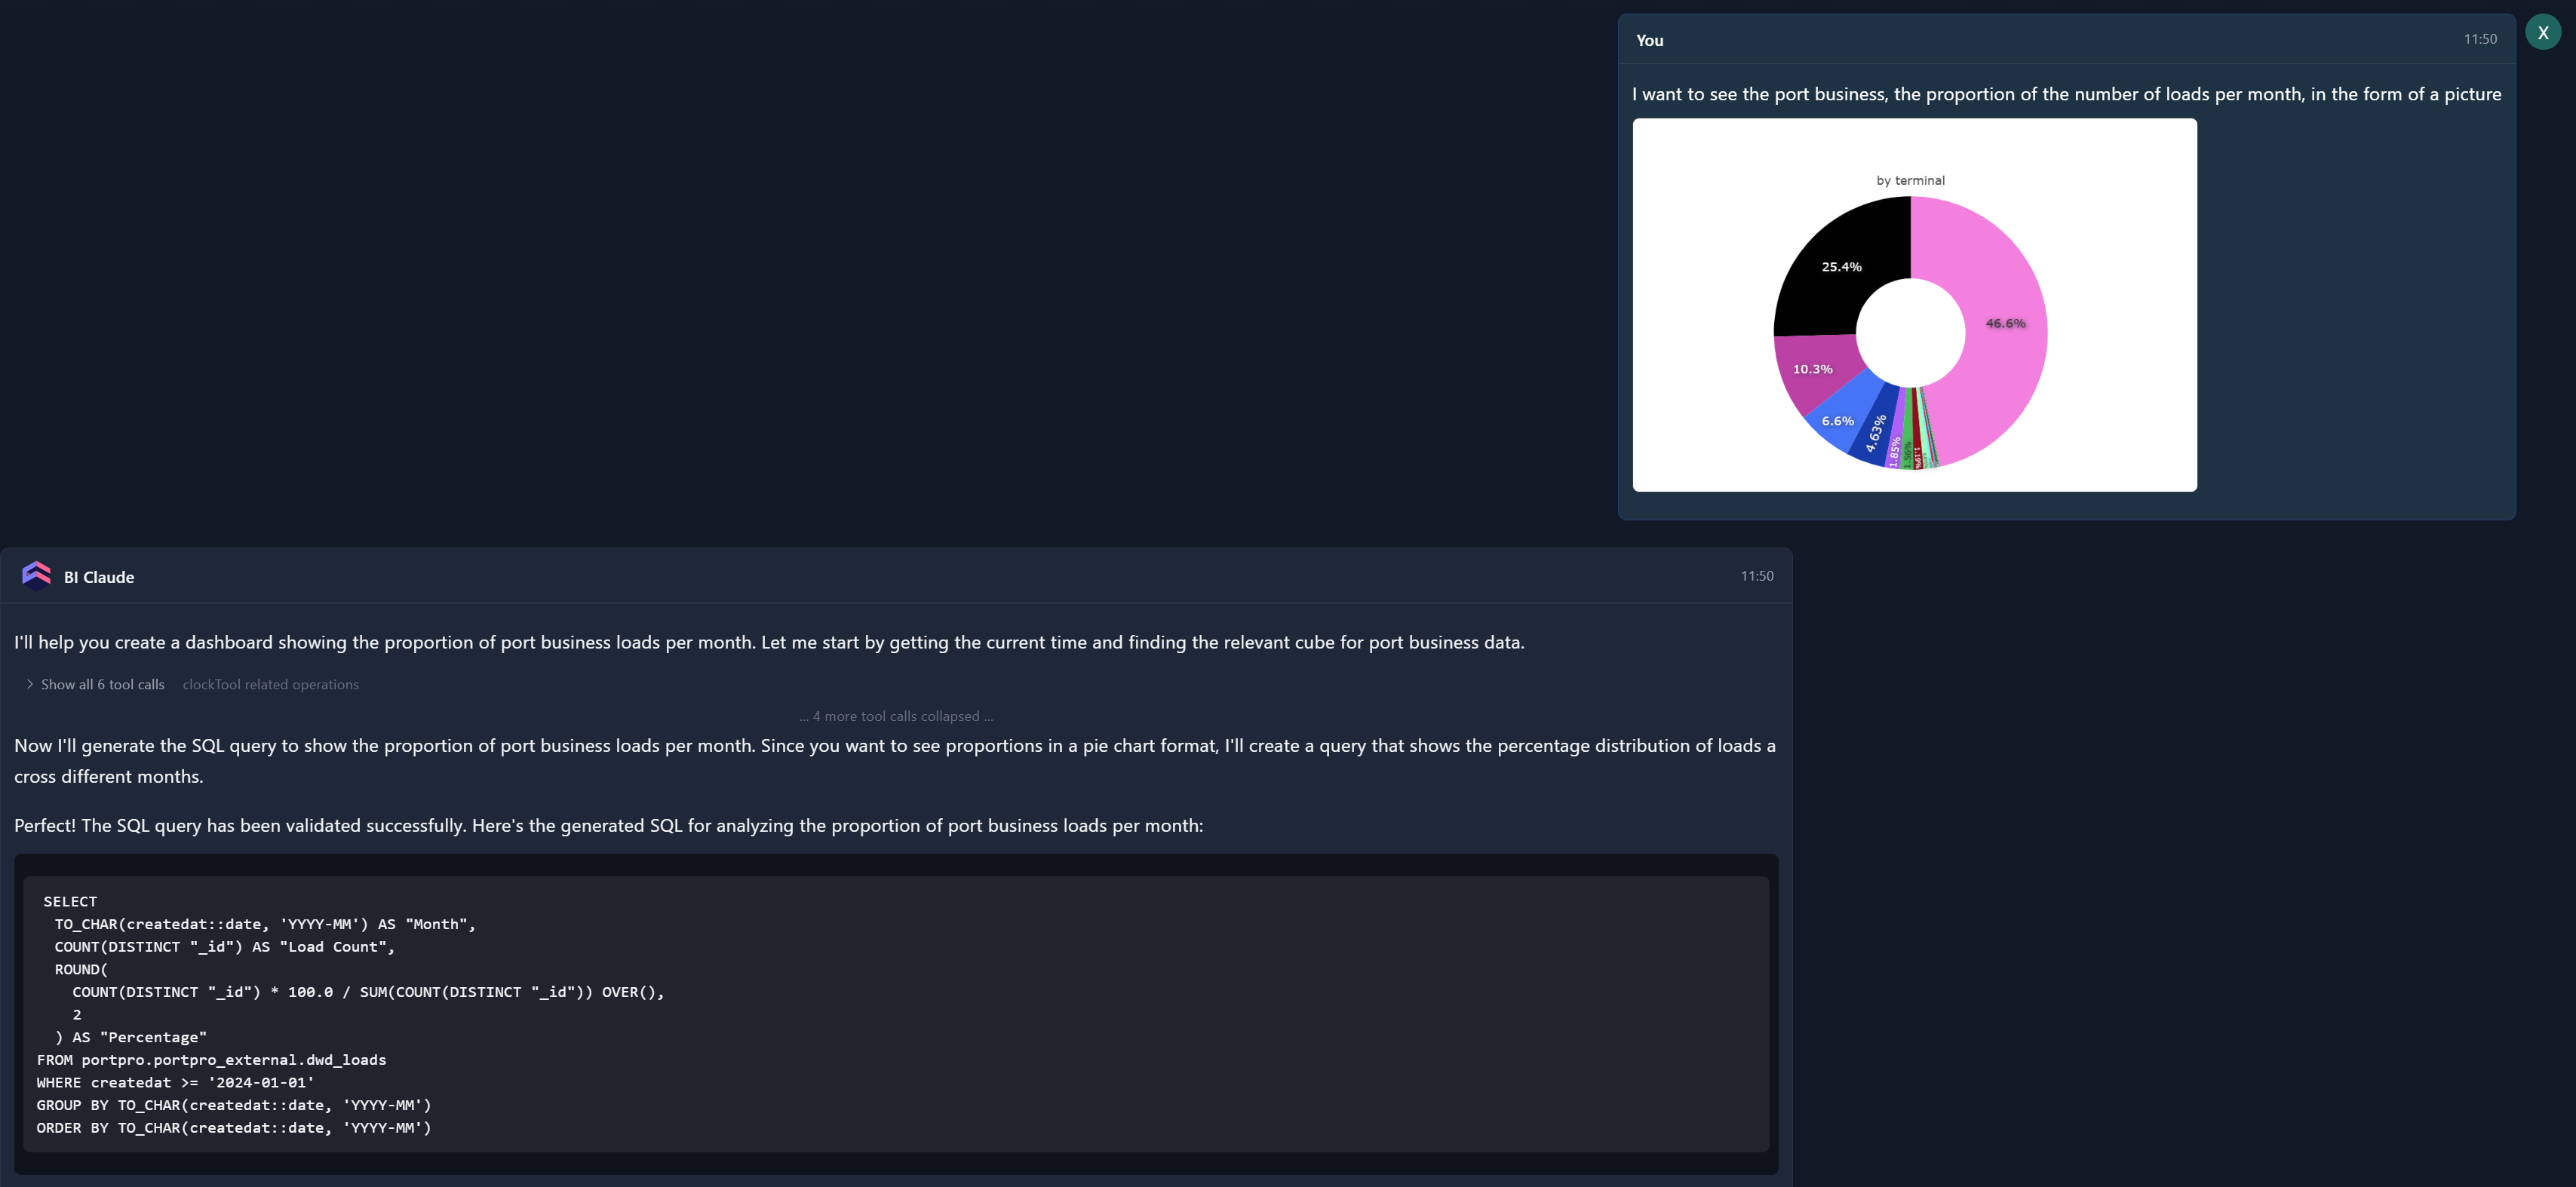
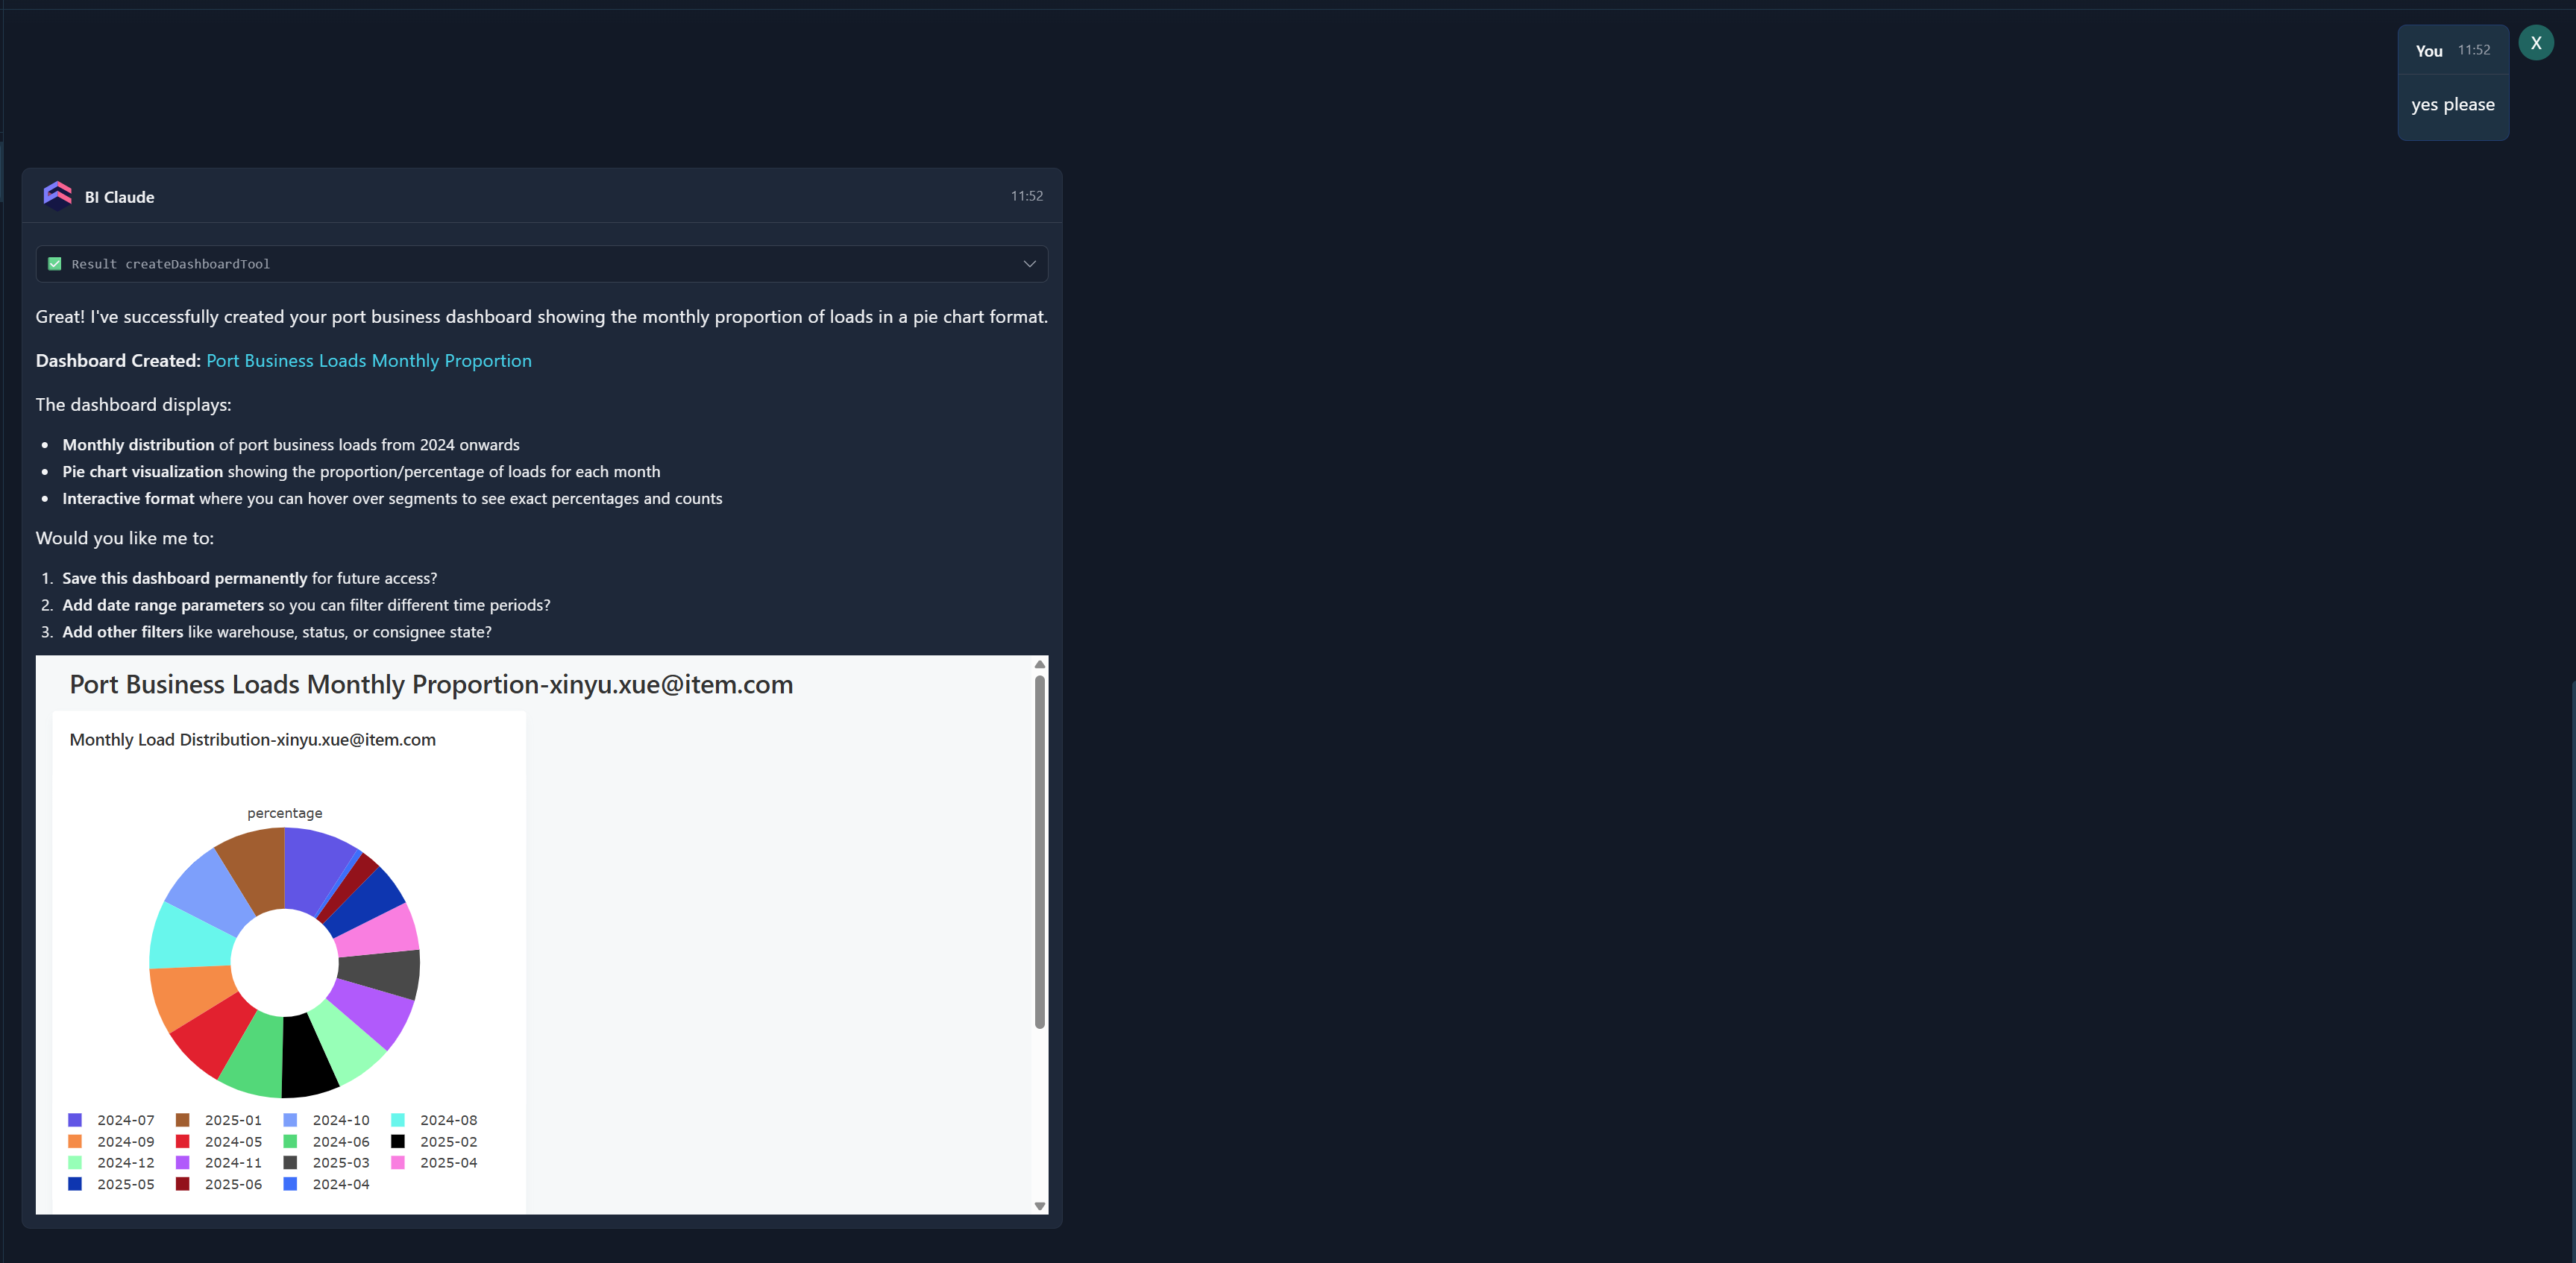
Q: I want to see the port business, the proportion of the number of loads per month, in the form of a picture
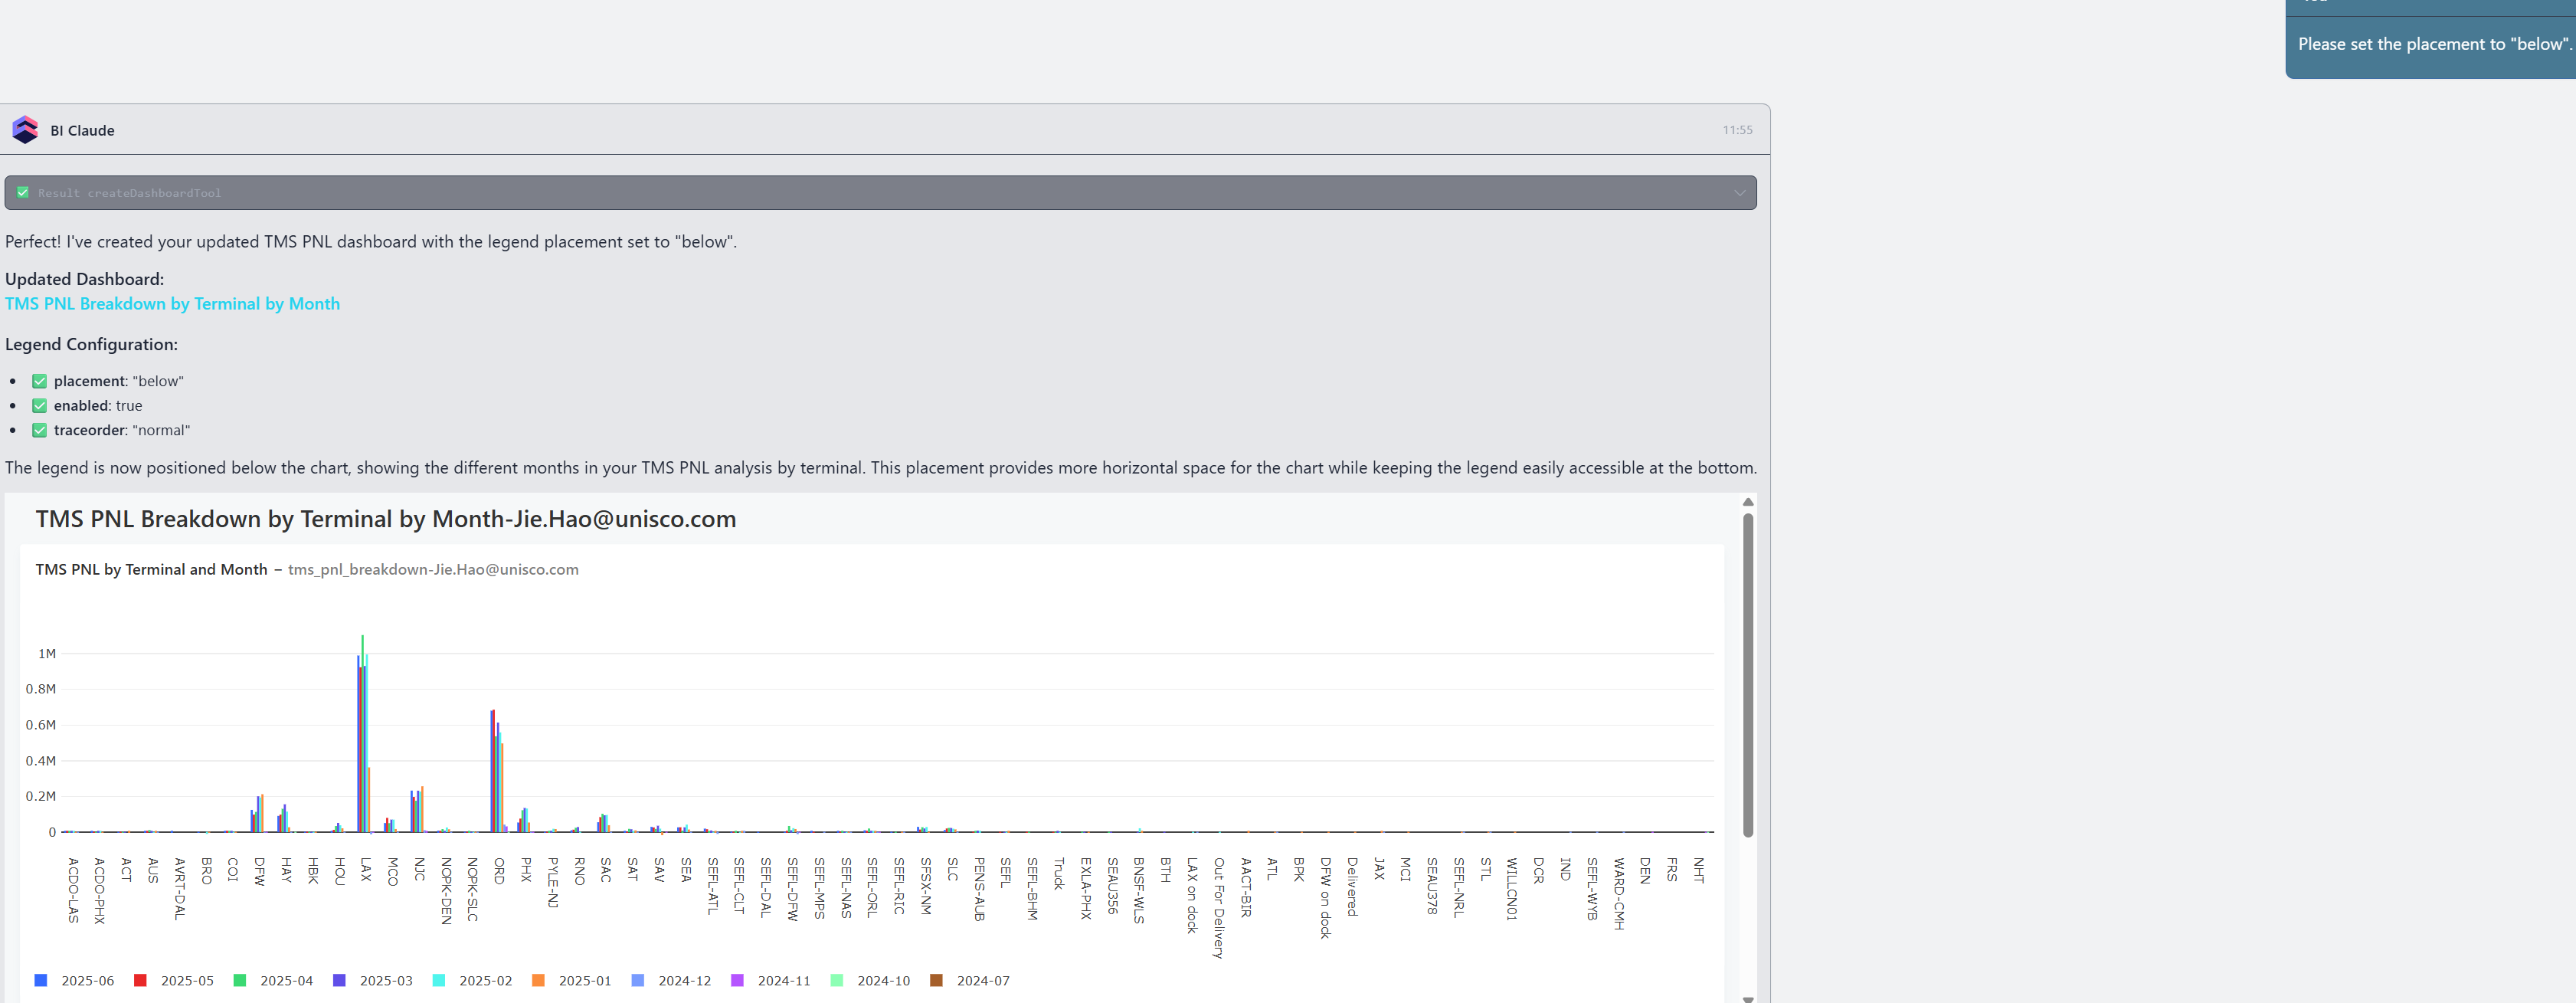
7 Adjust the legend position in the chart
By default, the chart legend is positioned on the right. Use the following command to move it to the bottom:
Q: Please set the placement to "below".
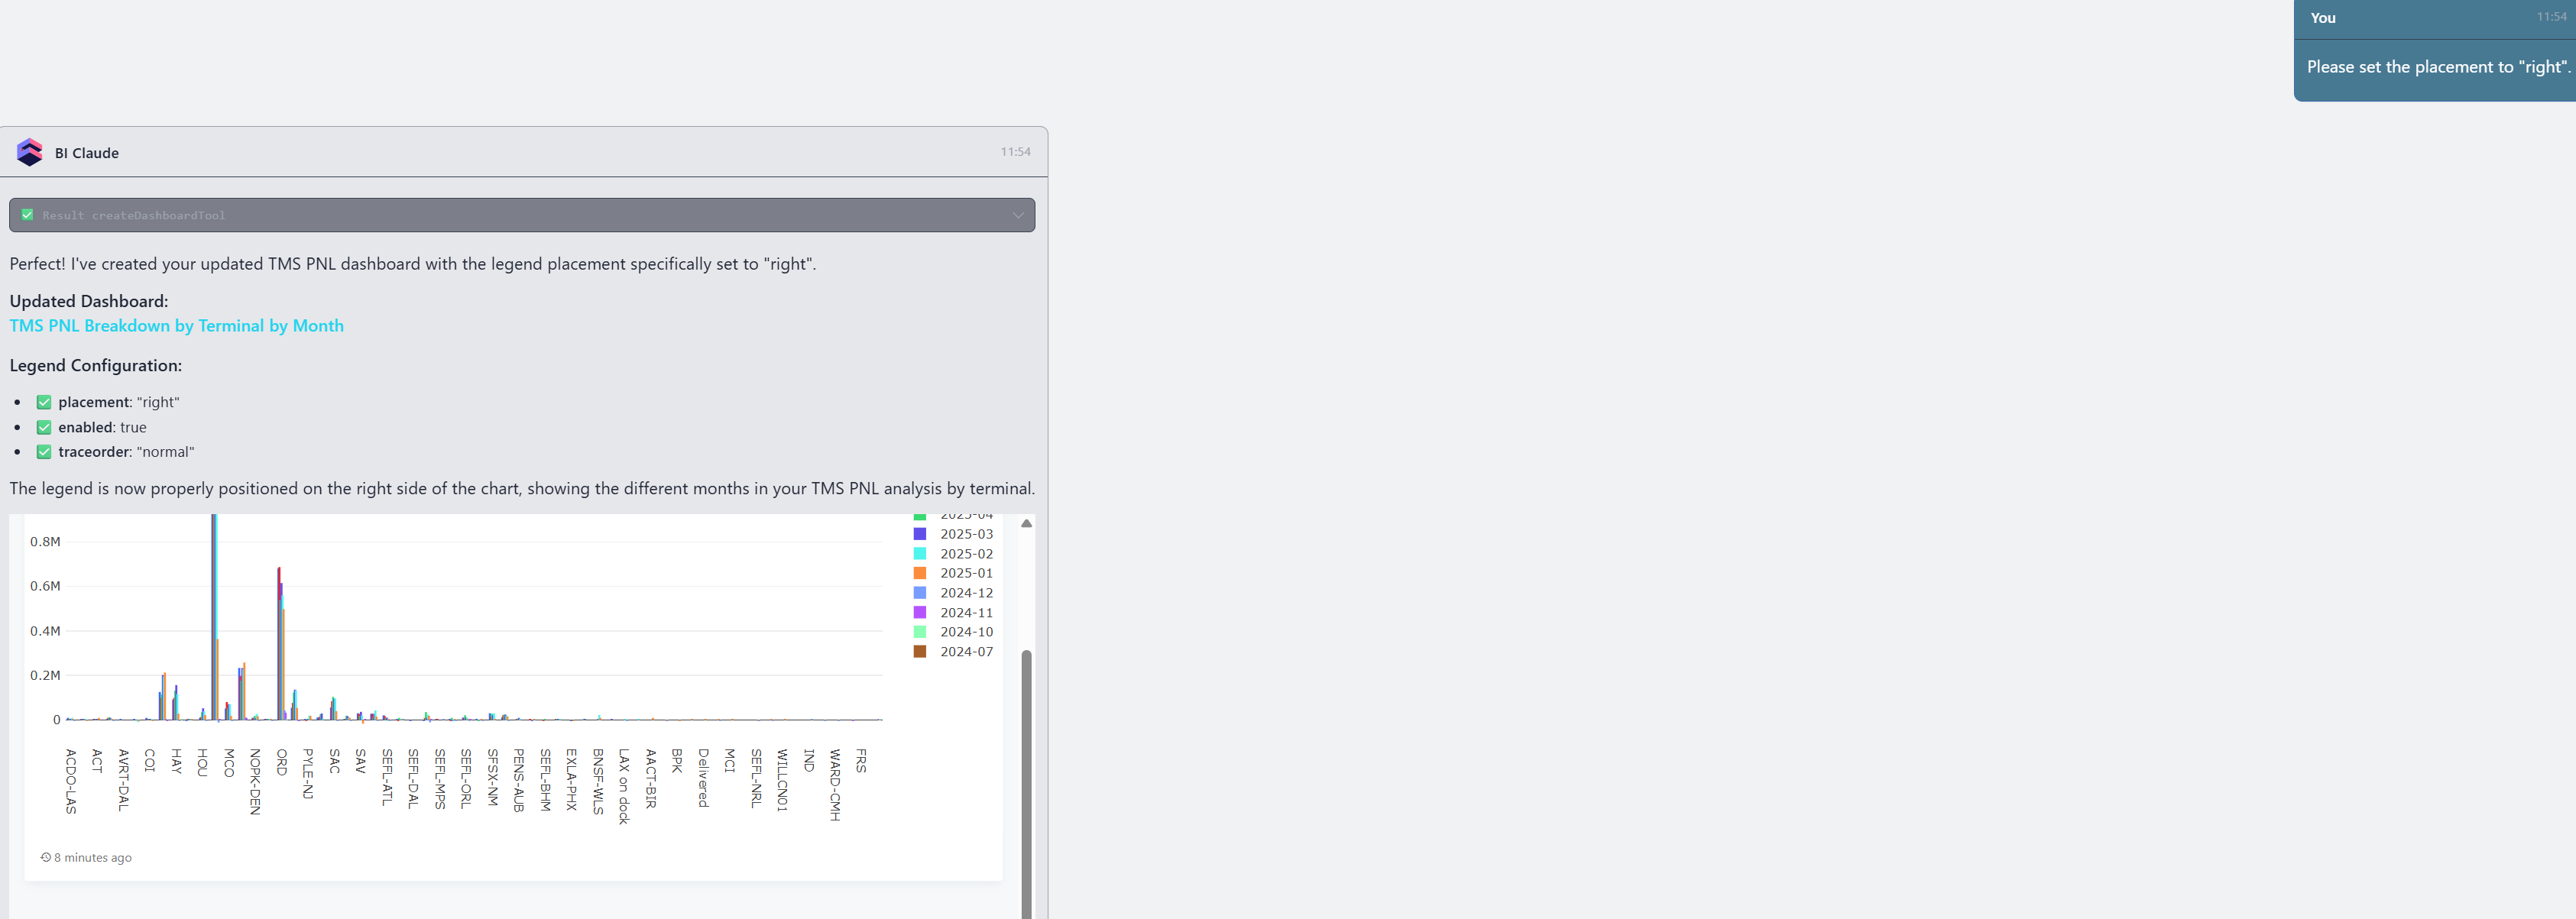
Then, change below back to right to return the legend to the right side.
Q: Please set the placement to "right".