Appearance
Cube User Guide
DIMENSIONS
Dimension fields support four data types: string, integer, date, and datetime.
They support SQL expressions, aliases, sorting, default values, and more. 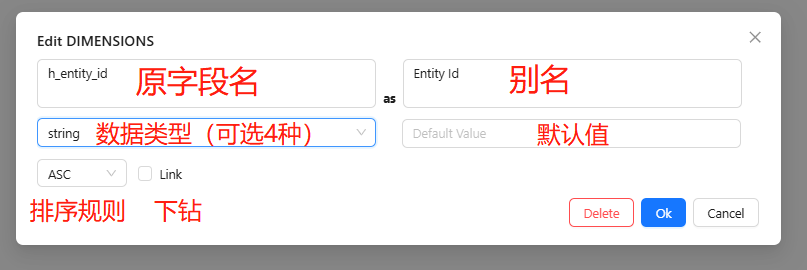
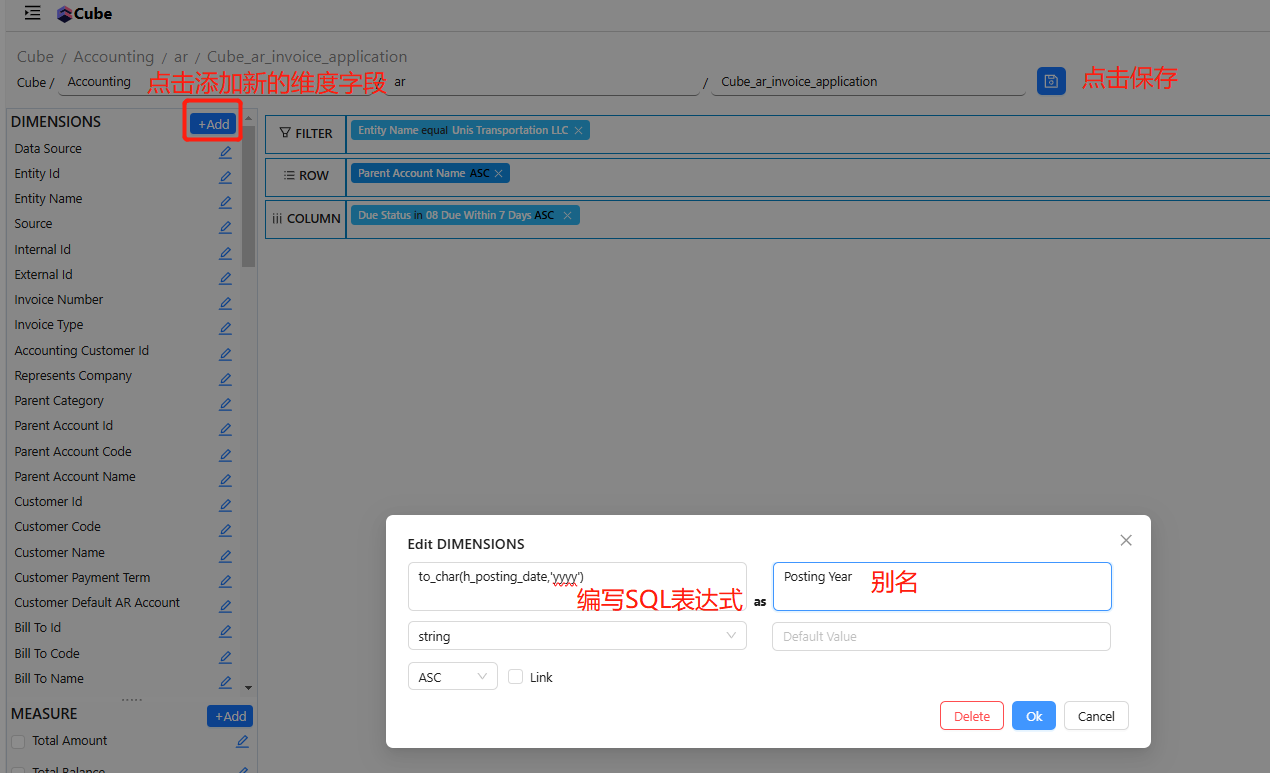
Adding a New Dimension Field
For example, to break a date field into year, month, and day — using h_posting_date = 2024-09-08 as an example:
sql
to_char(h_posting_date,'yyyy')    -- Returns the year: 2024
to_char(h_posting_date,'yyyy-mm') -- Returns year and month: 2024-09
to_char(h_posting_date,'mm')      -- Returns the month: 09
to_char(h_posting_date,'dd')      -- Returns the day: 08
After filling in the required information and clicking Save, return to the Cube page and click View to see your data. The newly created field will appear at the first position in the dimensions list.
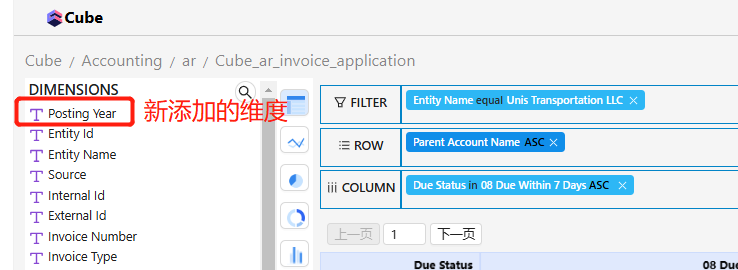
Note: Newly created fields are displayed first by default. Reordering dimensions is not currently supported.
Dimension Enum Value Configuration
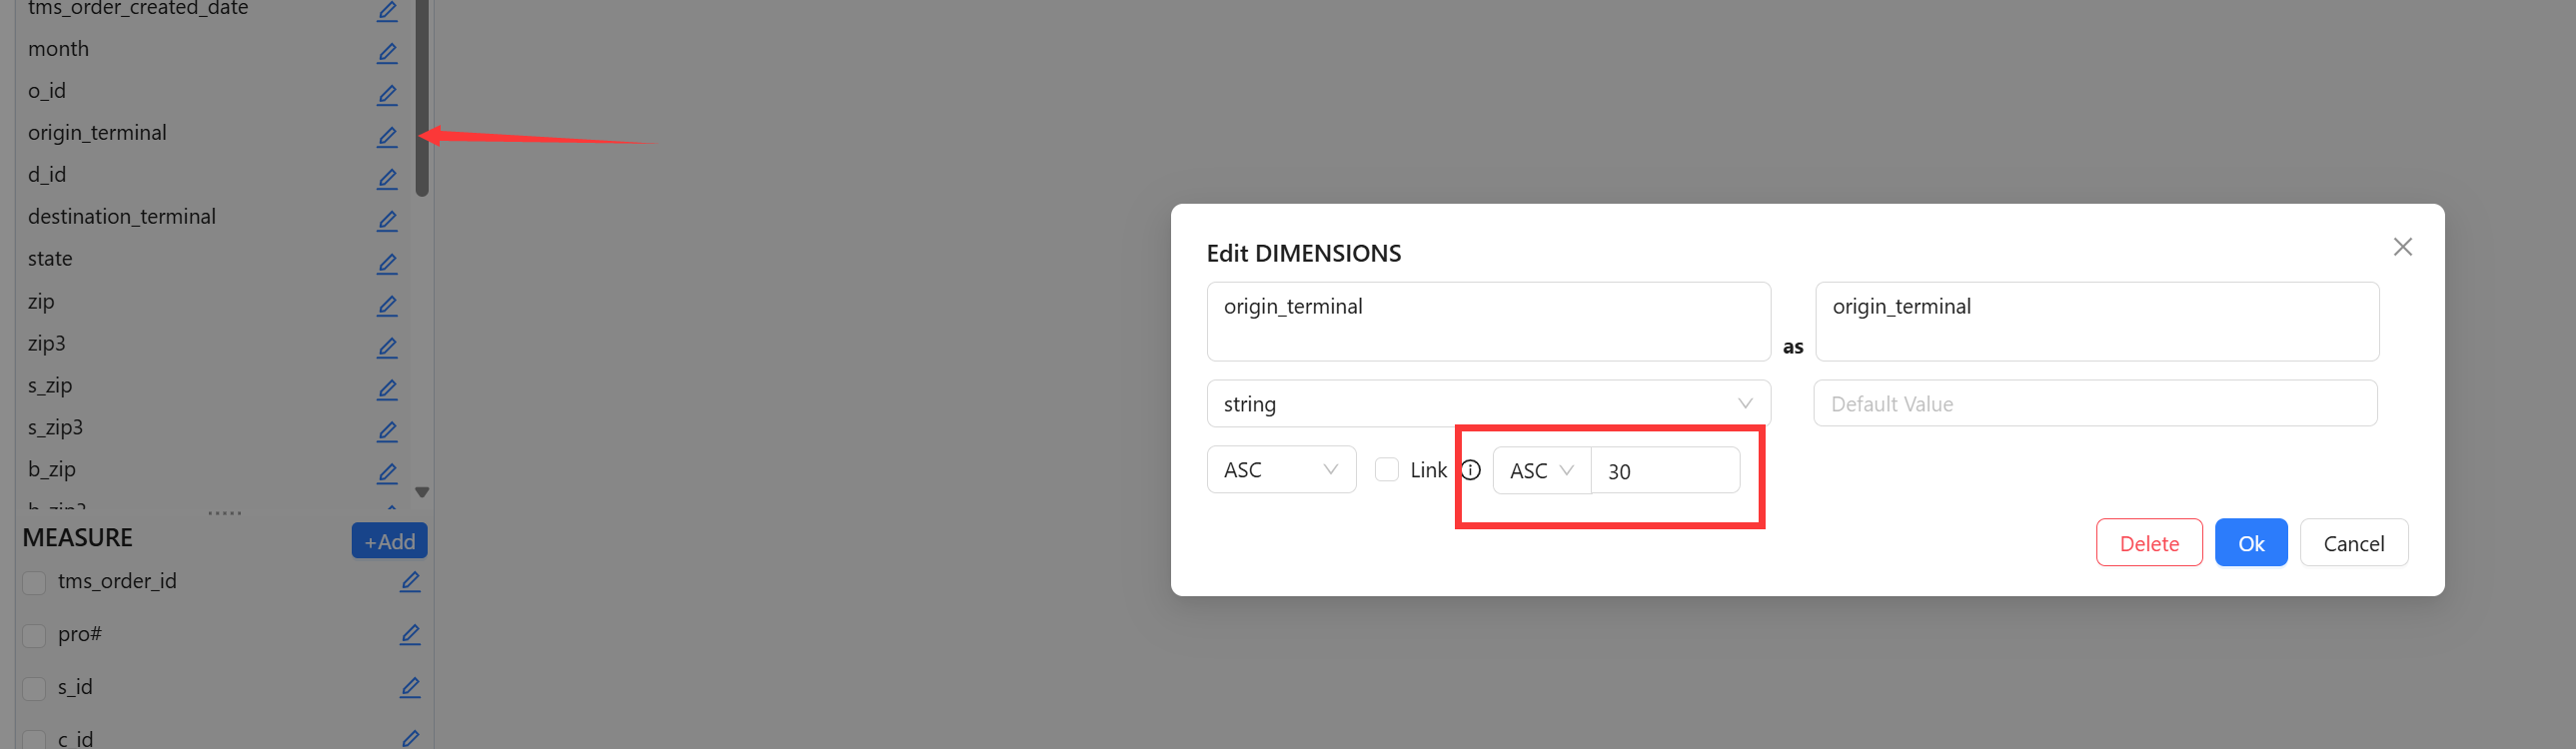
For string-type dimensions, the system provides a dropdown enumeration list, displaying the first 30 items in ascending order by default.
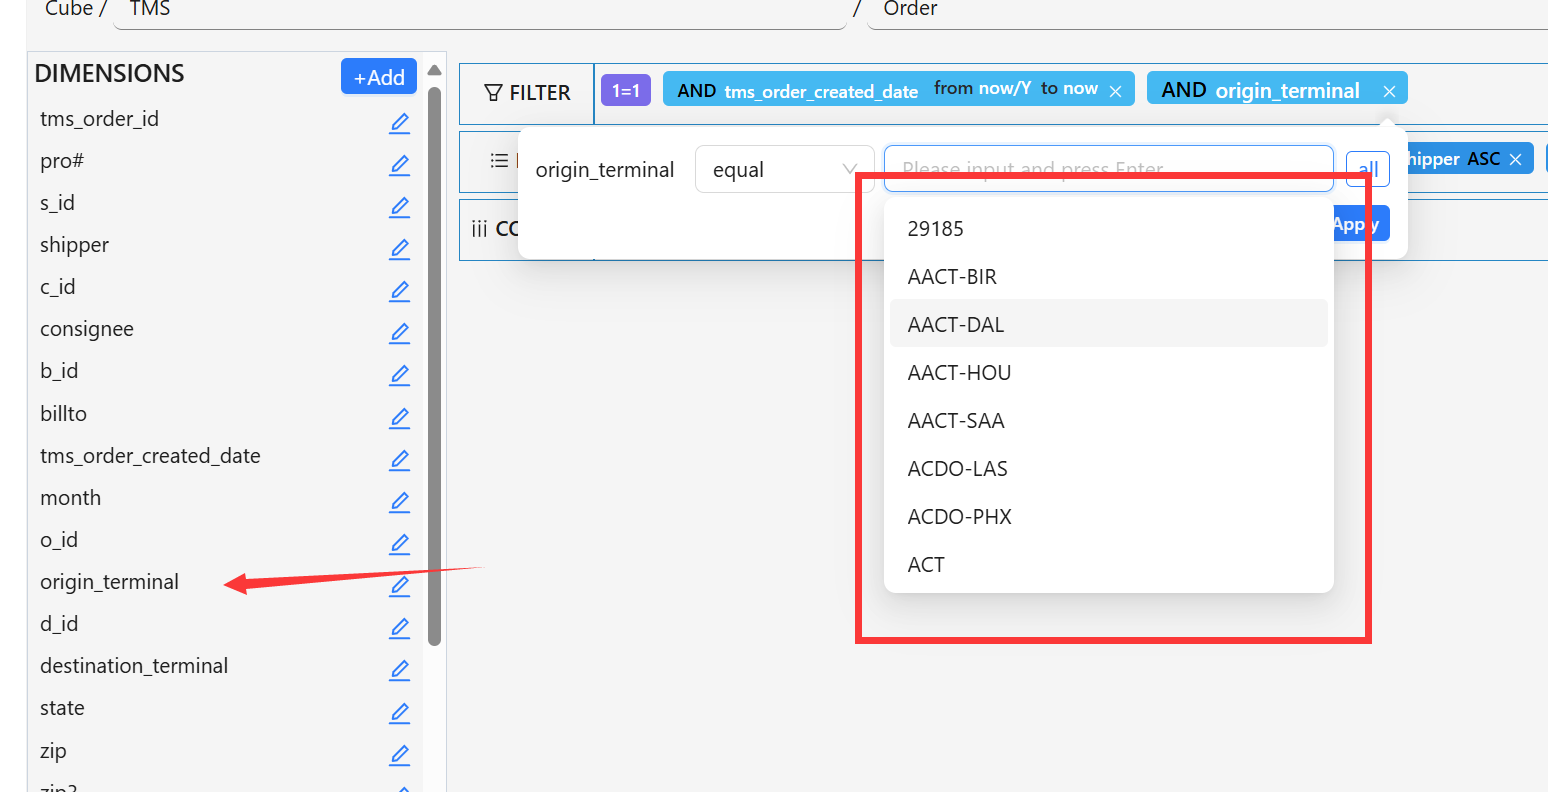
Click the Edit button to configure the sort order and quantity (positive integer, up to 100 items). After saving and exiting, re-enter the cube for changes to take effect.
Note: The dropdown list is only available when the dimension is placed in Filter or Column. It is not shown when the dimension is in Row.
MEASURES
Measure fields can be either numeric or string type.
If you only need to display detailed data, no measure fields are required.
Measures support filtering — drag a measure field into FILTER to apply conditions.
Note: Numeric measures support grand totals and subtotals. String measures do not support aggregation calculations and are generally not recommended.
Example: Adding a measure for the maximum posting date:
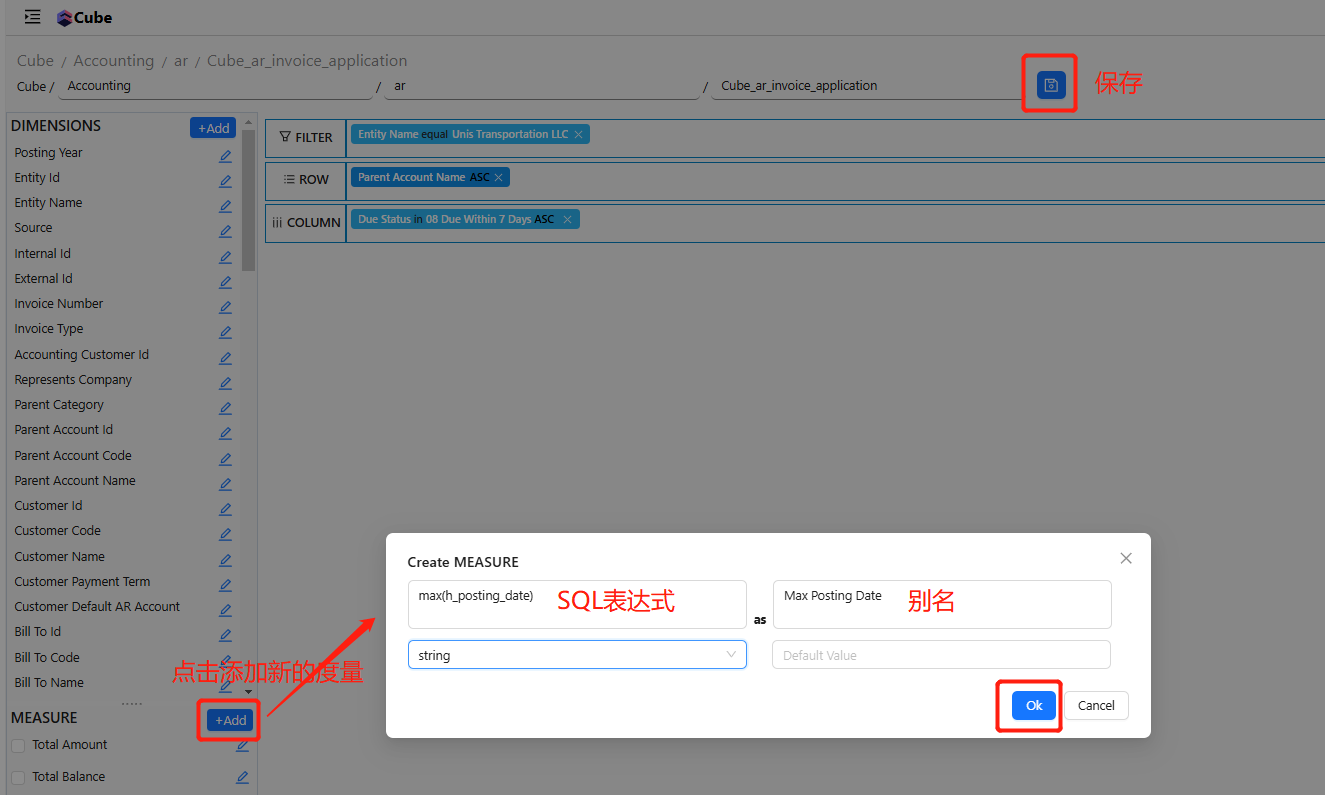
When editing a measure, always use an aggregate function (e.g., sum, min, max, average, count):
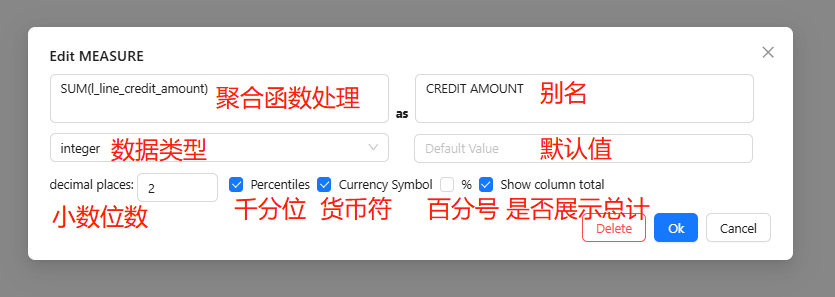
For a full list of supported aggregate functions, see:
https://docs.aws.amazon.com/redshift/latest/dg/c_Aggregate_Functions.html
To filter by a measure, drag it into FILTER and set the condition:

FILTER
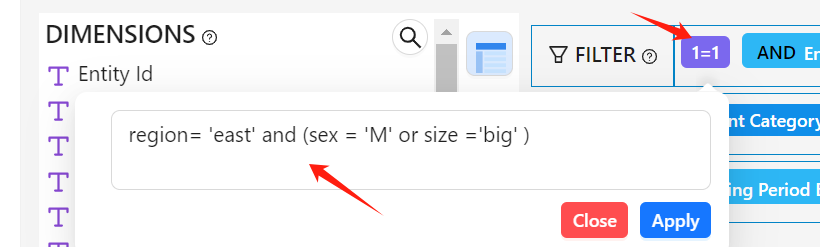
1=1
A custom condition field, written similarly to a SQL WHERE clause.
(1) String Type
equal
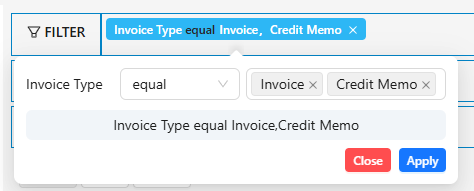
Invoice_Type = 'Invoice' AND Invoice_Type = 'Credit Memo'
Invoice_Type equals both Invoice and Credit Memo — this returns no data. Use in instead.
not equal
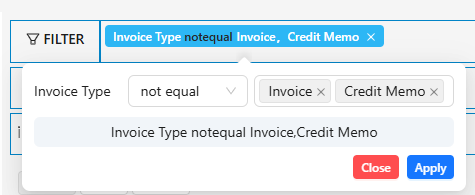
Invoice_Type <> 'Invoice' AND Invoice_Type <> 'Credit Memo'
Invoice_Type is neither Invoice nor Credit Memo.
begin with
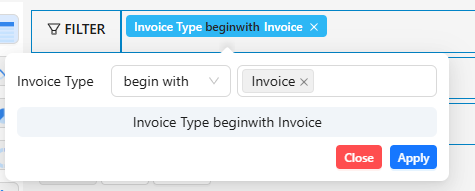
Invoice_Type like 'Invoice%' — starts with "Invoice"
not begin with
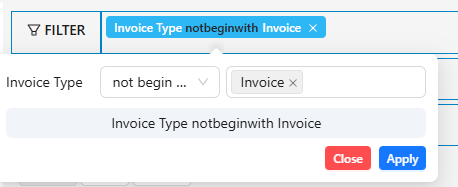
Invoice_Type not like 'Invoice%' — does not start with "Invoice"
end with
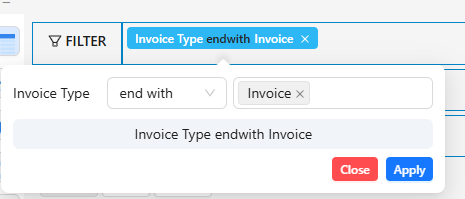
Invoice_Type like '%Invoice' — ends with "Invoice"
not end with
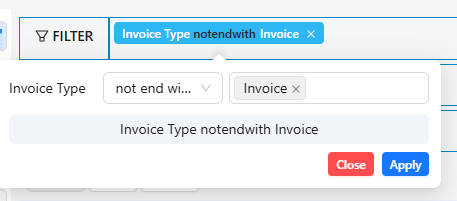
Invoice_Type not like '%Invoice' — does not end with "Invoice"
contains
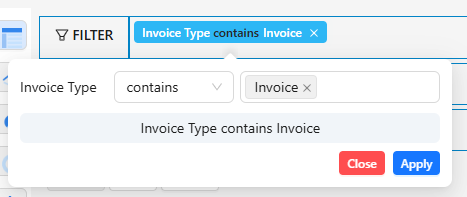
Invoice_Type like '%Invoice%' — contains "Invoice"
not contains
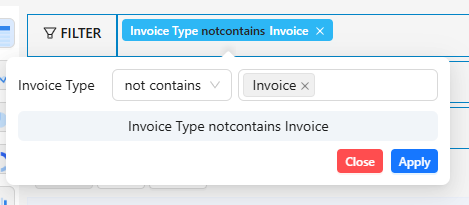
Invoice_Type not like '%Invoice%' — does not contain "Invoice"
in
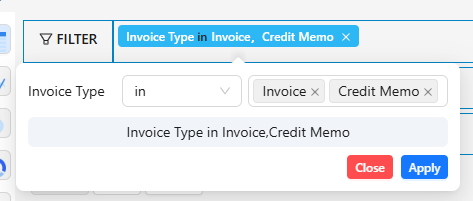
Invoice_Type = 'Invoice' or Invoice_Type = 'Credit Memo'
Invoice_Type equals Invoice or Credit Memo.
not in
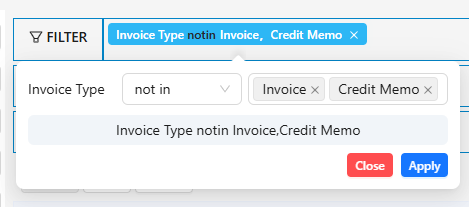
Invoice_Type <> 'Invoice' AND Invoice_Type <> 'Credit Memo'
Invoice_Type is neither Invoice nor Credit Memo.
(2) Numeric Type
=

Total_Amount = 100
>
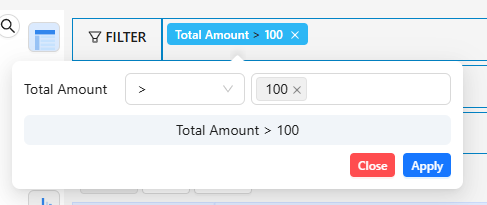
Total_Amount > 100
>=
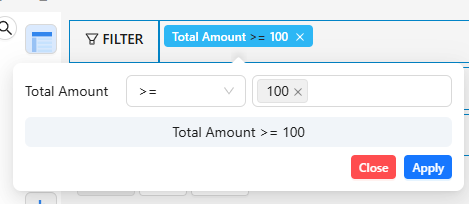
Total_Amount >= 100
<
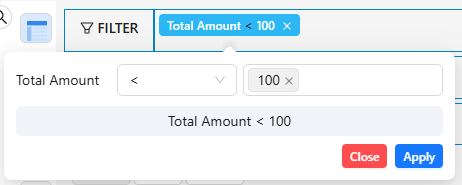
Total_Amount < 100
<=
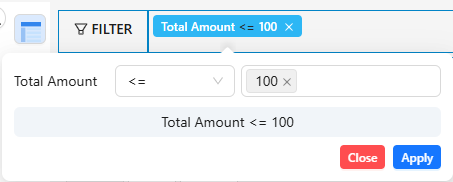
Total_Amount <= 100
in
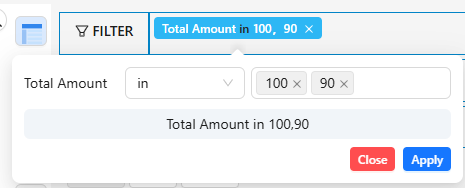
Total_Amount in(100,90) — equals 100 or 90
not in
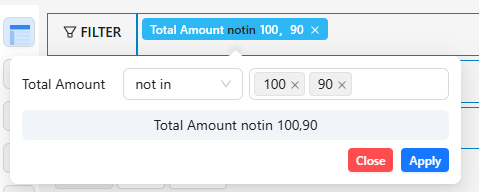
Total_Amount not in(100,90) — not equal to 100 or 90
(3) Date Type
Expression
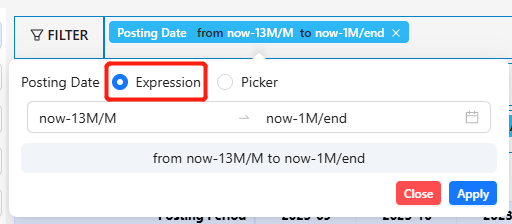
Example: the past 13 months.
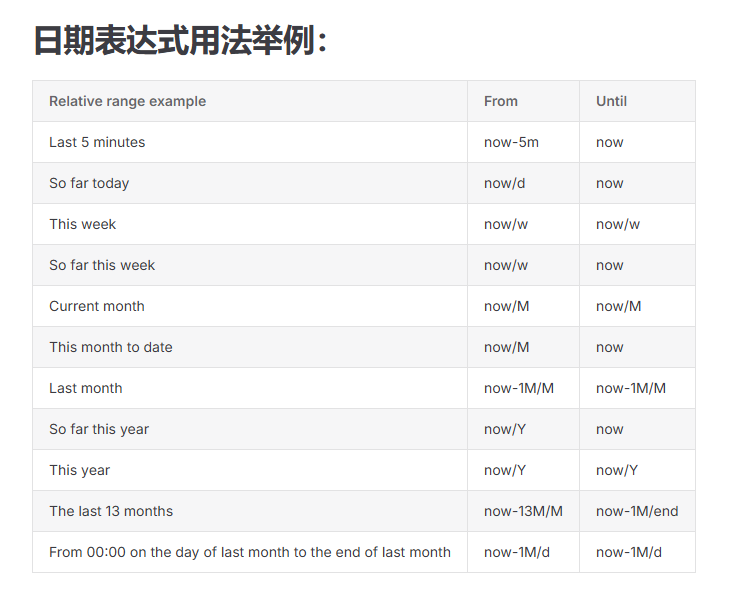
For date expression usage examples, see:
http://hello-bi.s3-website-us-west-2.amazonaws.com/documents/Example/DateControlExpression.html
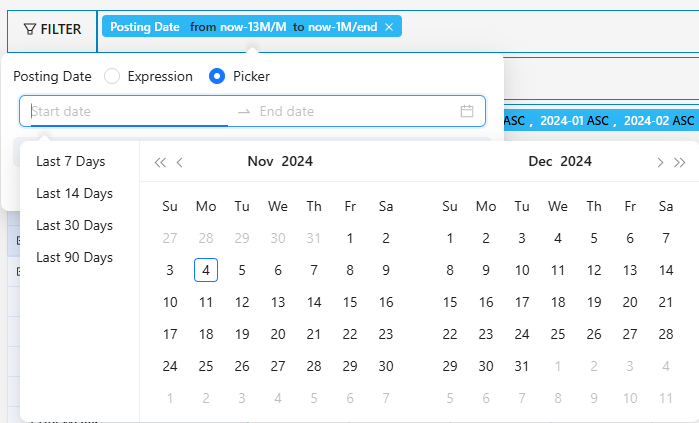
Picker
(4) DateTime Type
Expression
Example: the past 13 months.
For date expression usage examples, see:
http://hello-bi.s3-website-us-west-2.amazonaws.com/documents/Example/DateControlExpression.html
Picker
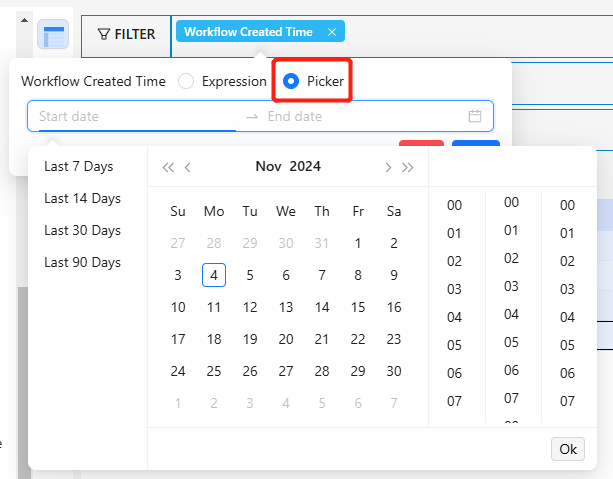
DateTime fields support selecting hours, minutes, and seconds in the picker.
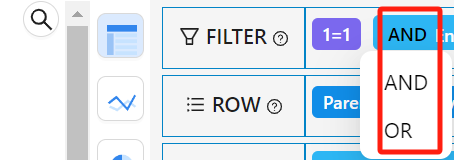
(5) AND / OR
Click on 'Select Relationship Symbol'
(6) Customize Filter SQL
Enter a custom WHERE SQL
ROW
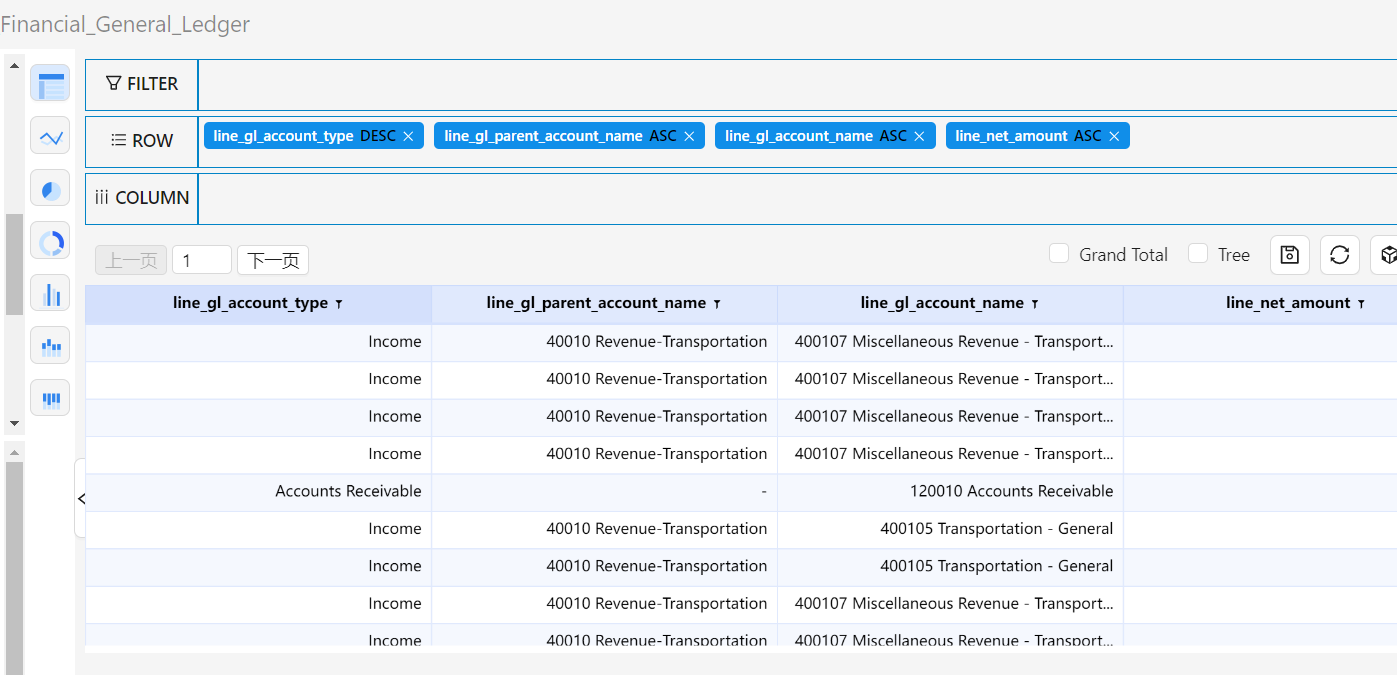
The table structure supports both regular and pivot table layouts. Adding fields to ROW determines how data is grouped and displayed.
Example: Different rows are displayed clearly based on what you drag into ROW. Without any ROW fields, all rows and columns of the cube are displayed.
COLUMN
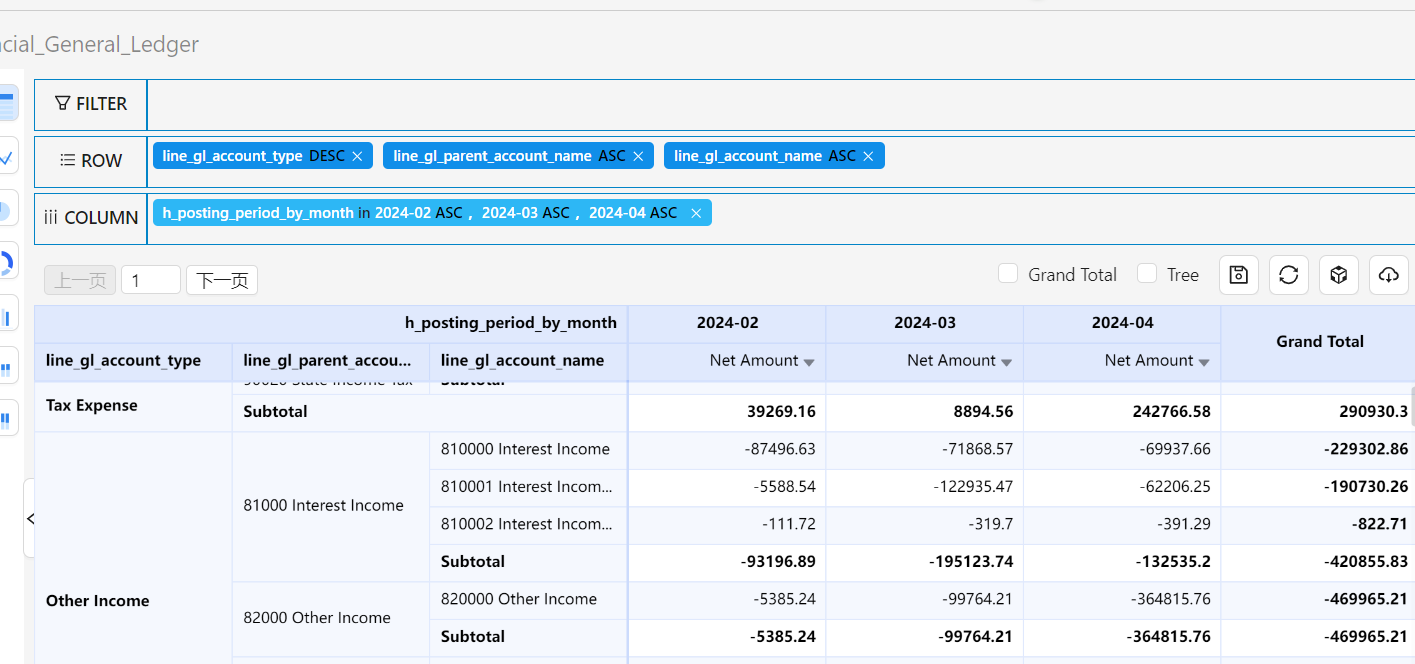
Column headers for pivot tables. Only used when you need to display data in pivot format; otherwise, leave it empty.
1. Pivot analysis in financial reporting — Row-to-column transformation quickly generates pivot reports across different time periods, such as expanding annual sales data by month for multi-dimensional comparison.
2. Statistical aggregation — Flexible dimension definition allows you to aggregate data by specific attributes, such as showing totals or averages of a given attribute in a summary report.
Example: Click a field in COLUMN to select the values to display as columns. Supports custom input (press Enter to confirm) and multi-select.
Note: When COLUMN has values, ROW and MEASURES cannot be empty. You must also select at least one enum value for each field in COLUMN — dragging a field to COLUMN without selecting a value will not produce the expected result.
Charts
In addition to Grid view, Cube provides basic chart types including line, pie, donut, bar, stacked bar, and more.
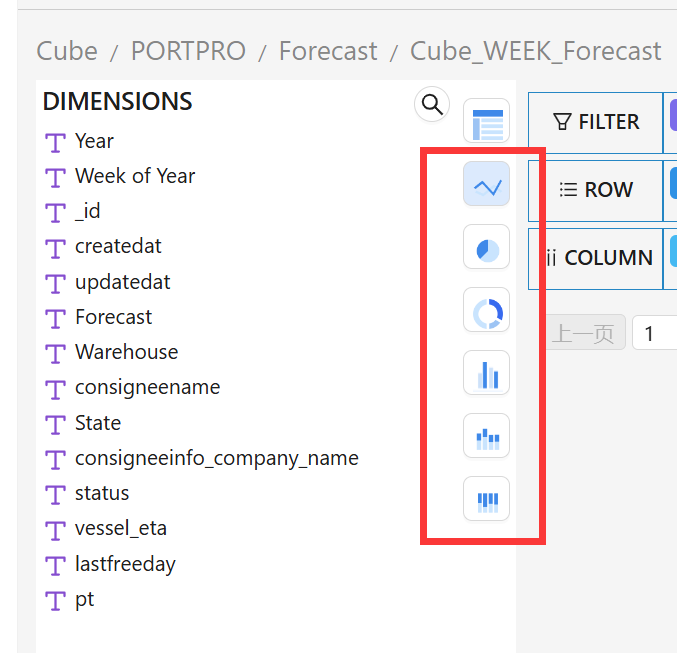
Charts require the following prerequisites: both ROW and COLUMN must have values, and at least one measure must be selected.
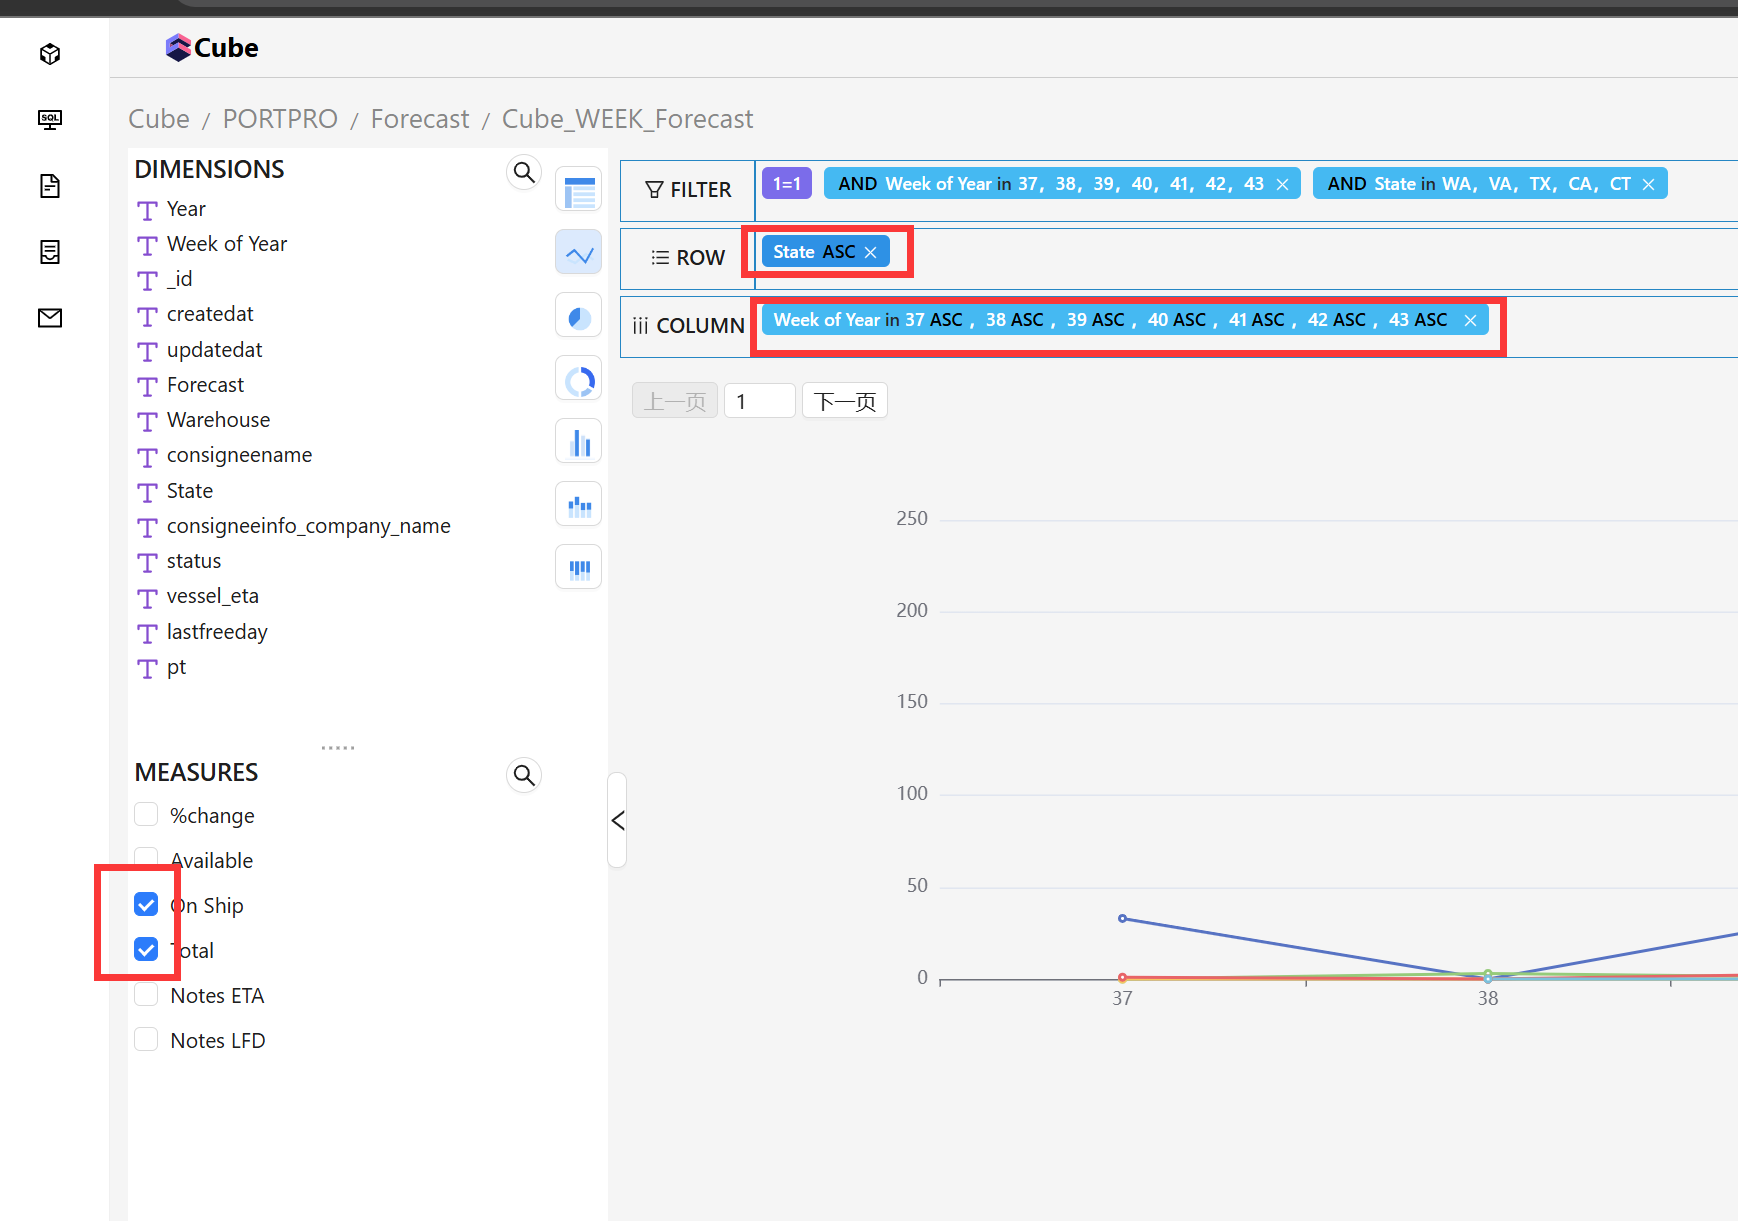
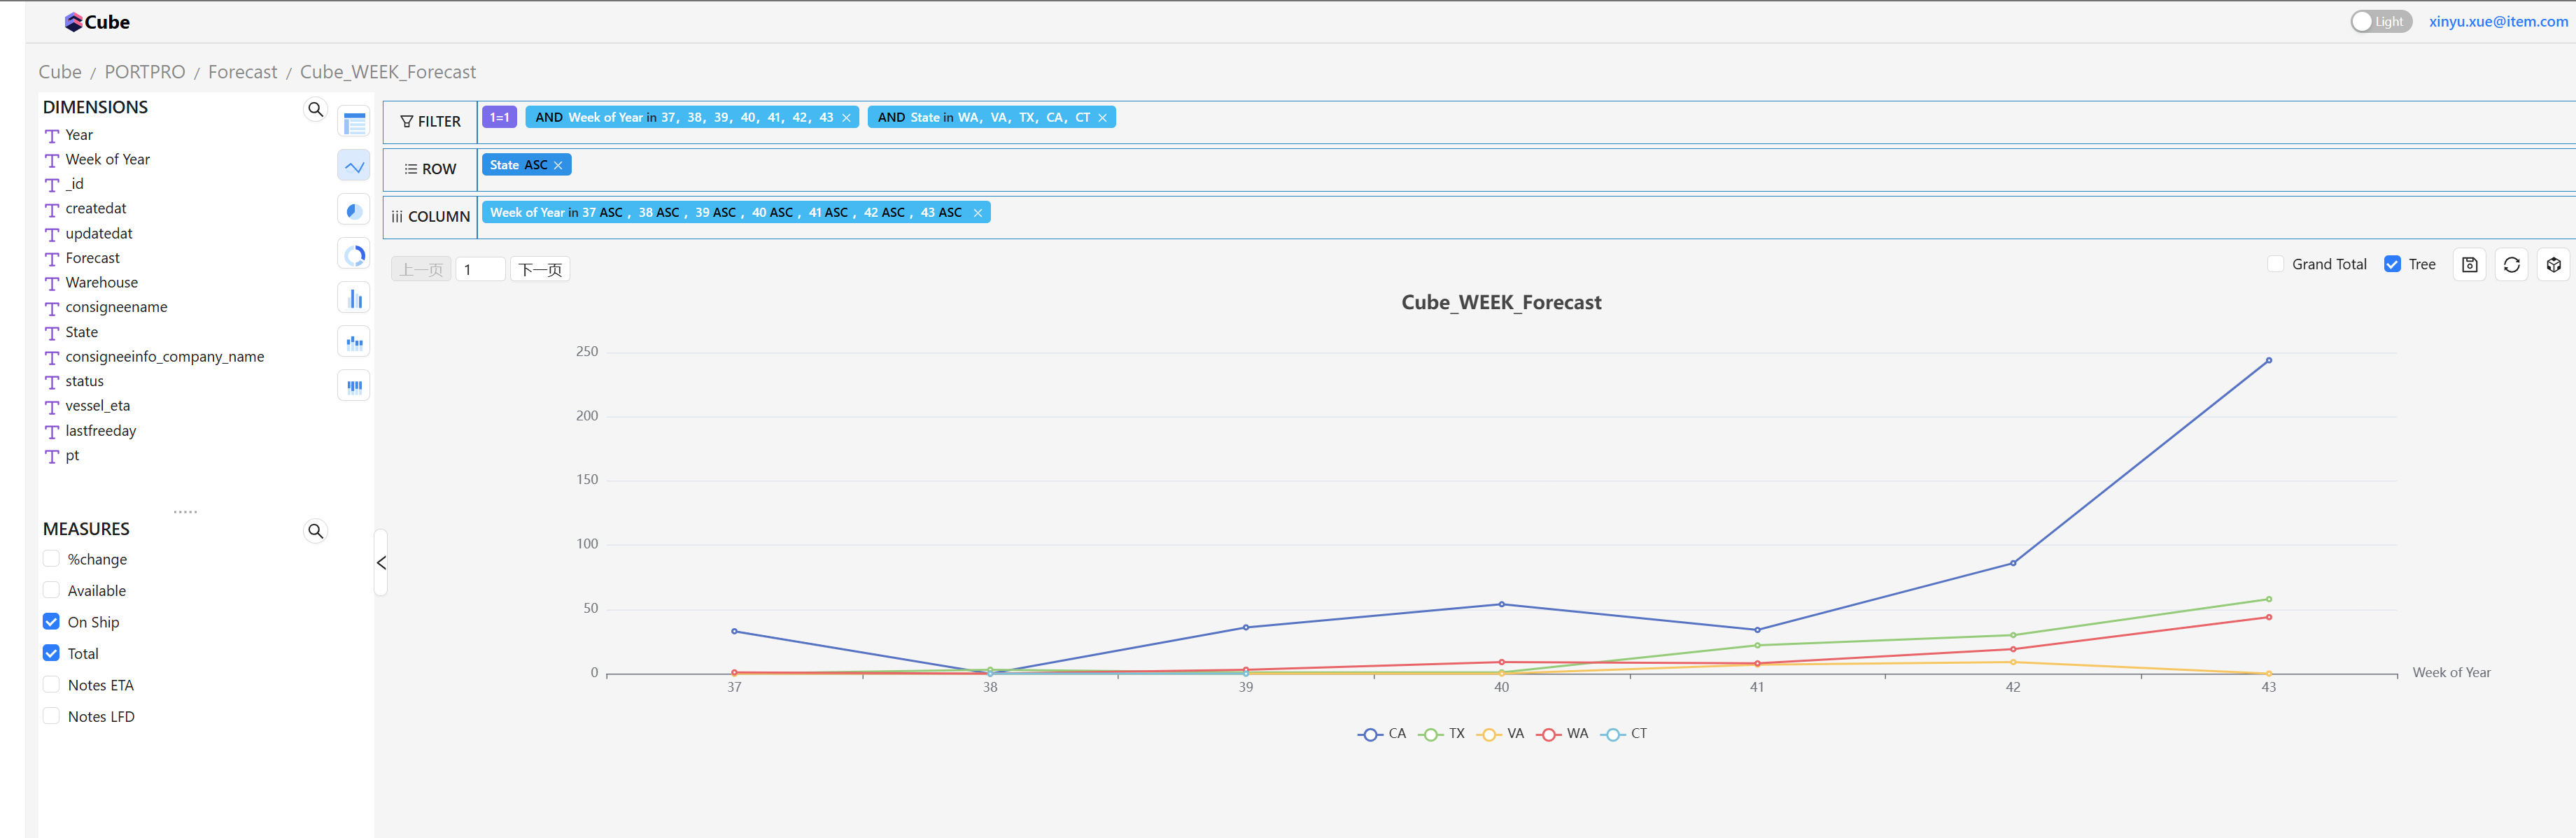
Line Chart
A line chart connects data points with line segments, showing trends over time or other continuous variables. It is well-suited for displaying trends or periodic fluctuations.
The horizontal axis represents COLUMN values, the vertical axis represents measures (the first measure is shown by default when multiple are selected), and each line represents a ROW value.
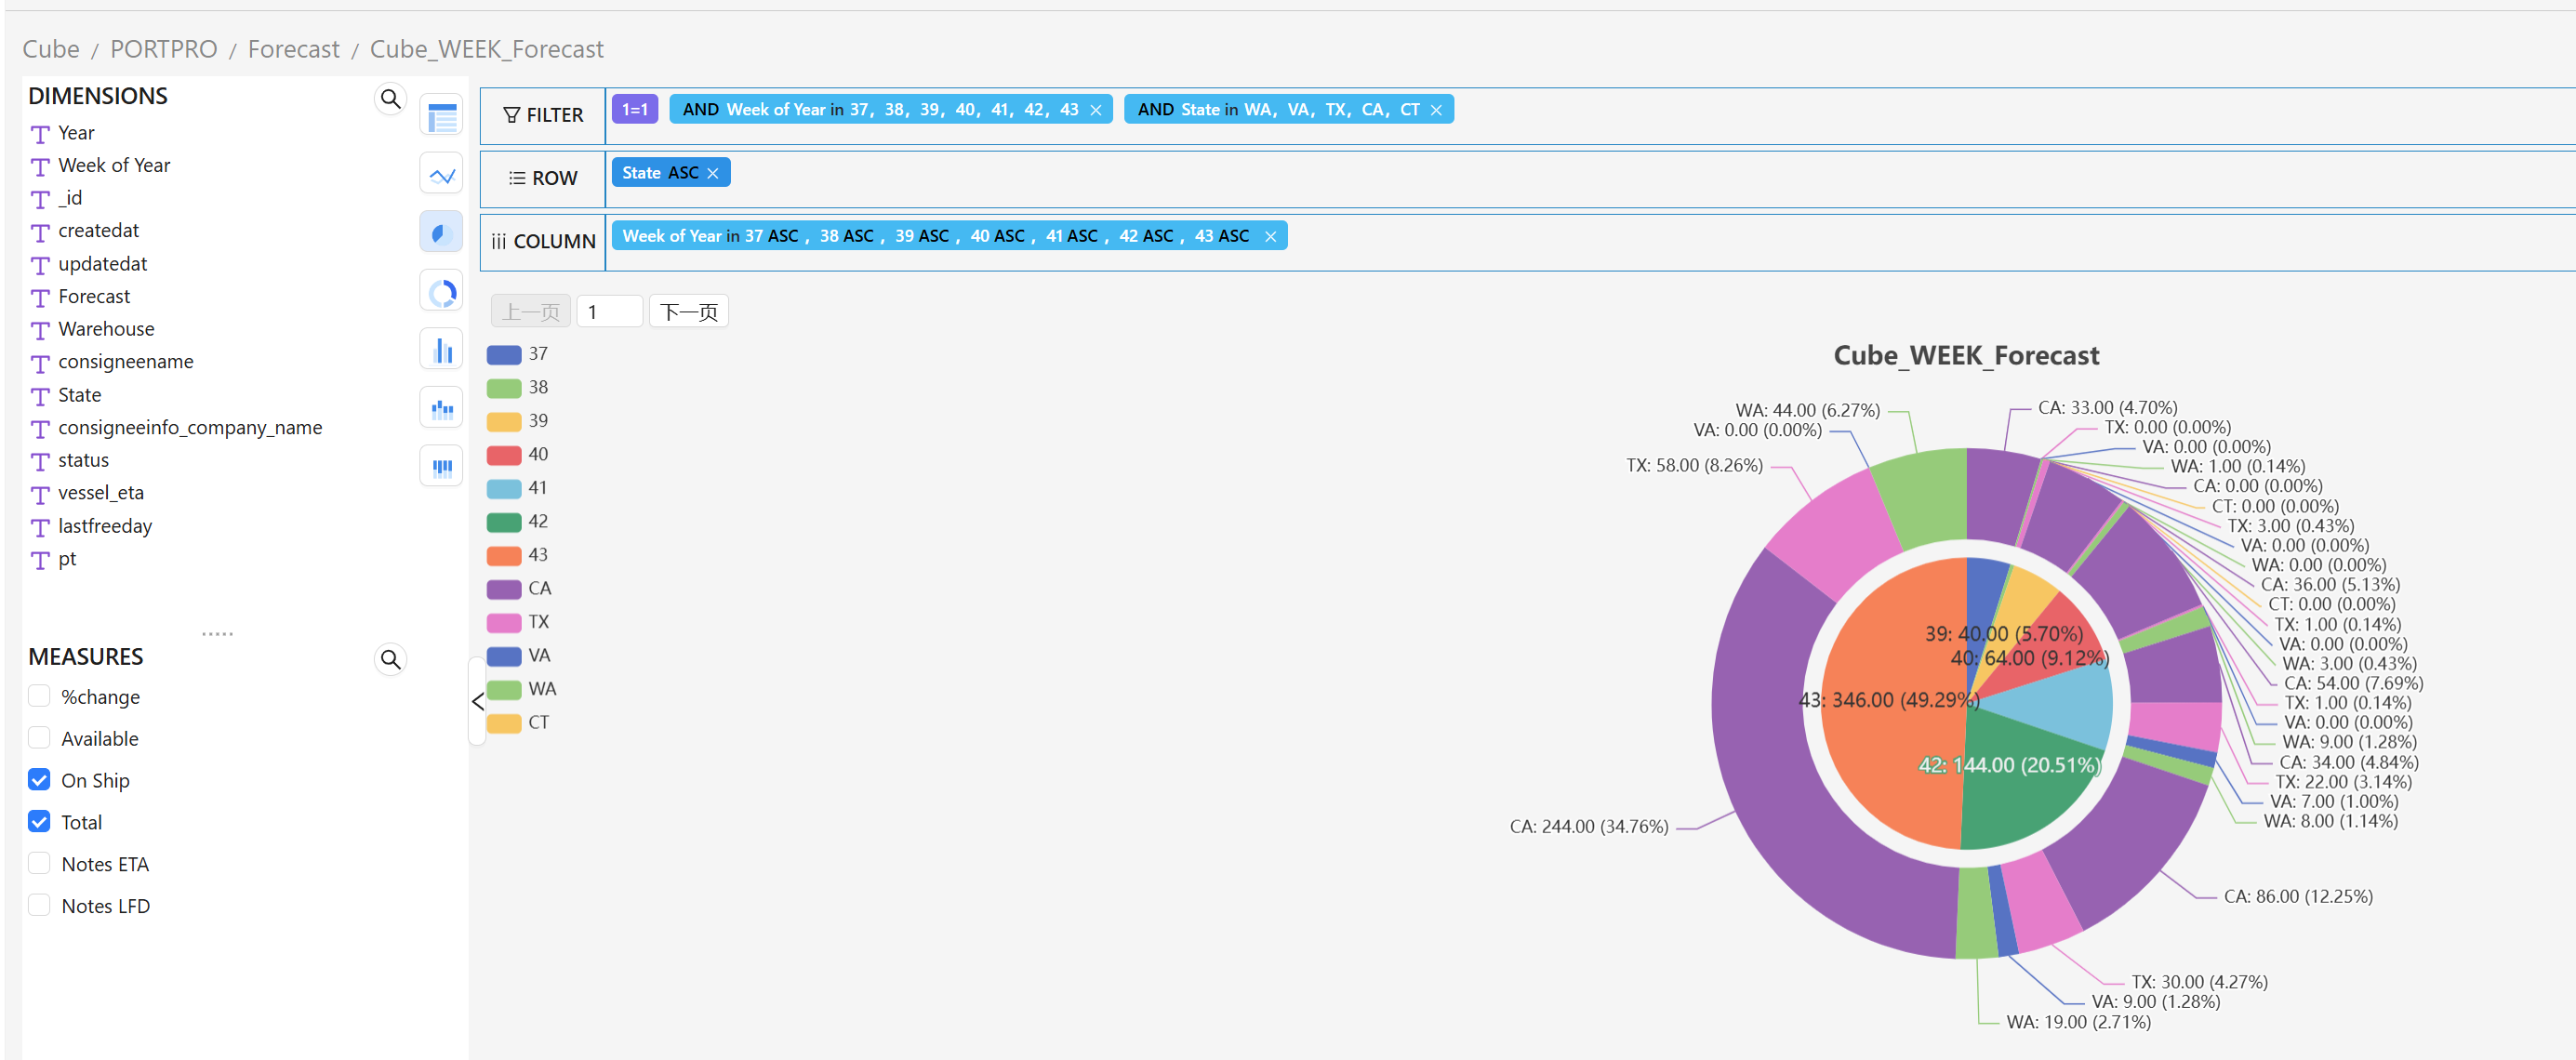
Pie Chart
A pie chart displays proportions or percentages of data. The whole circle represents 100%, and each sector represents a category's percentage. Ideal for comparing parts of a whole.
This is a nested pie chart: the inner ring represents COLUMN, the outer ring represents ROW, and the first measure is shown by default.
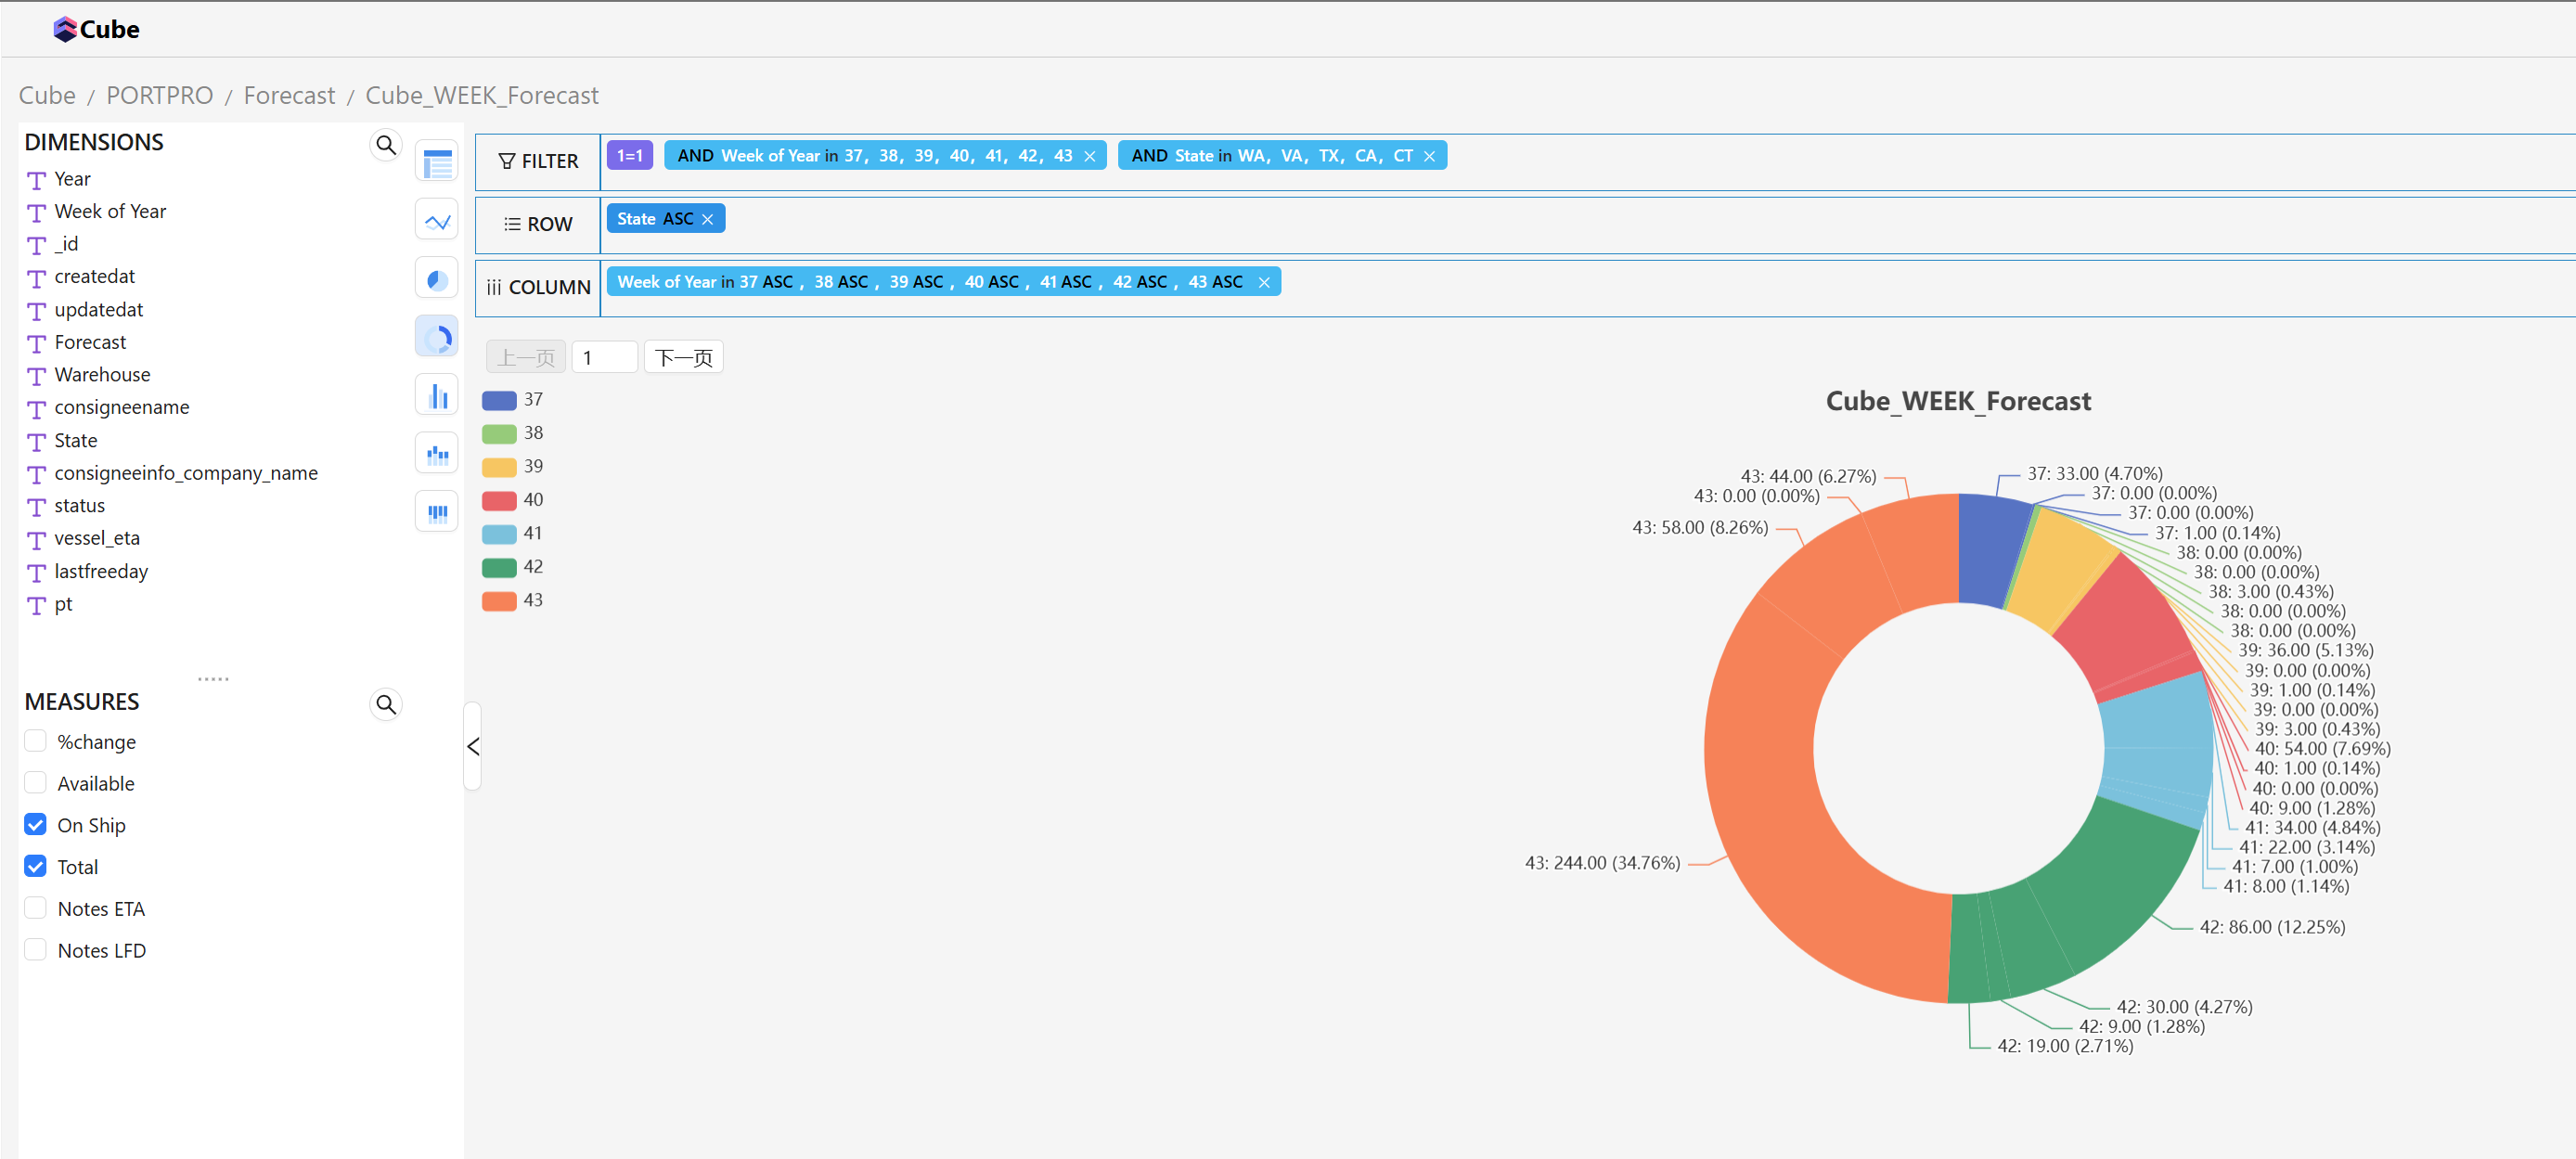
Ring Chart
A ring (donut) chart is a variant of the pie chart with a hollow center. It can display multiple categories' proportions while the center area can show additional information.
Different colors represent COLUMN; segments within the same color represent ROW.
Bar Chart
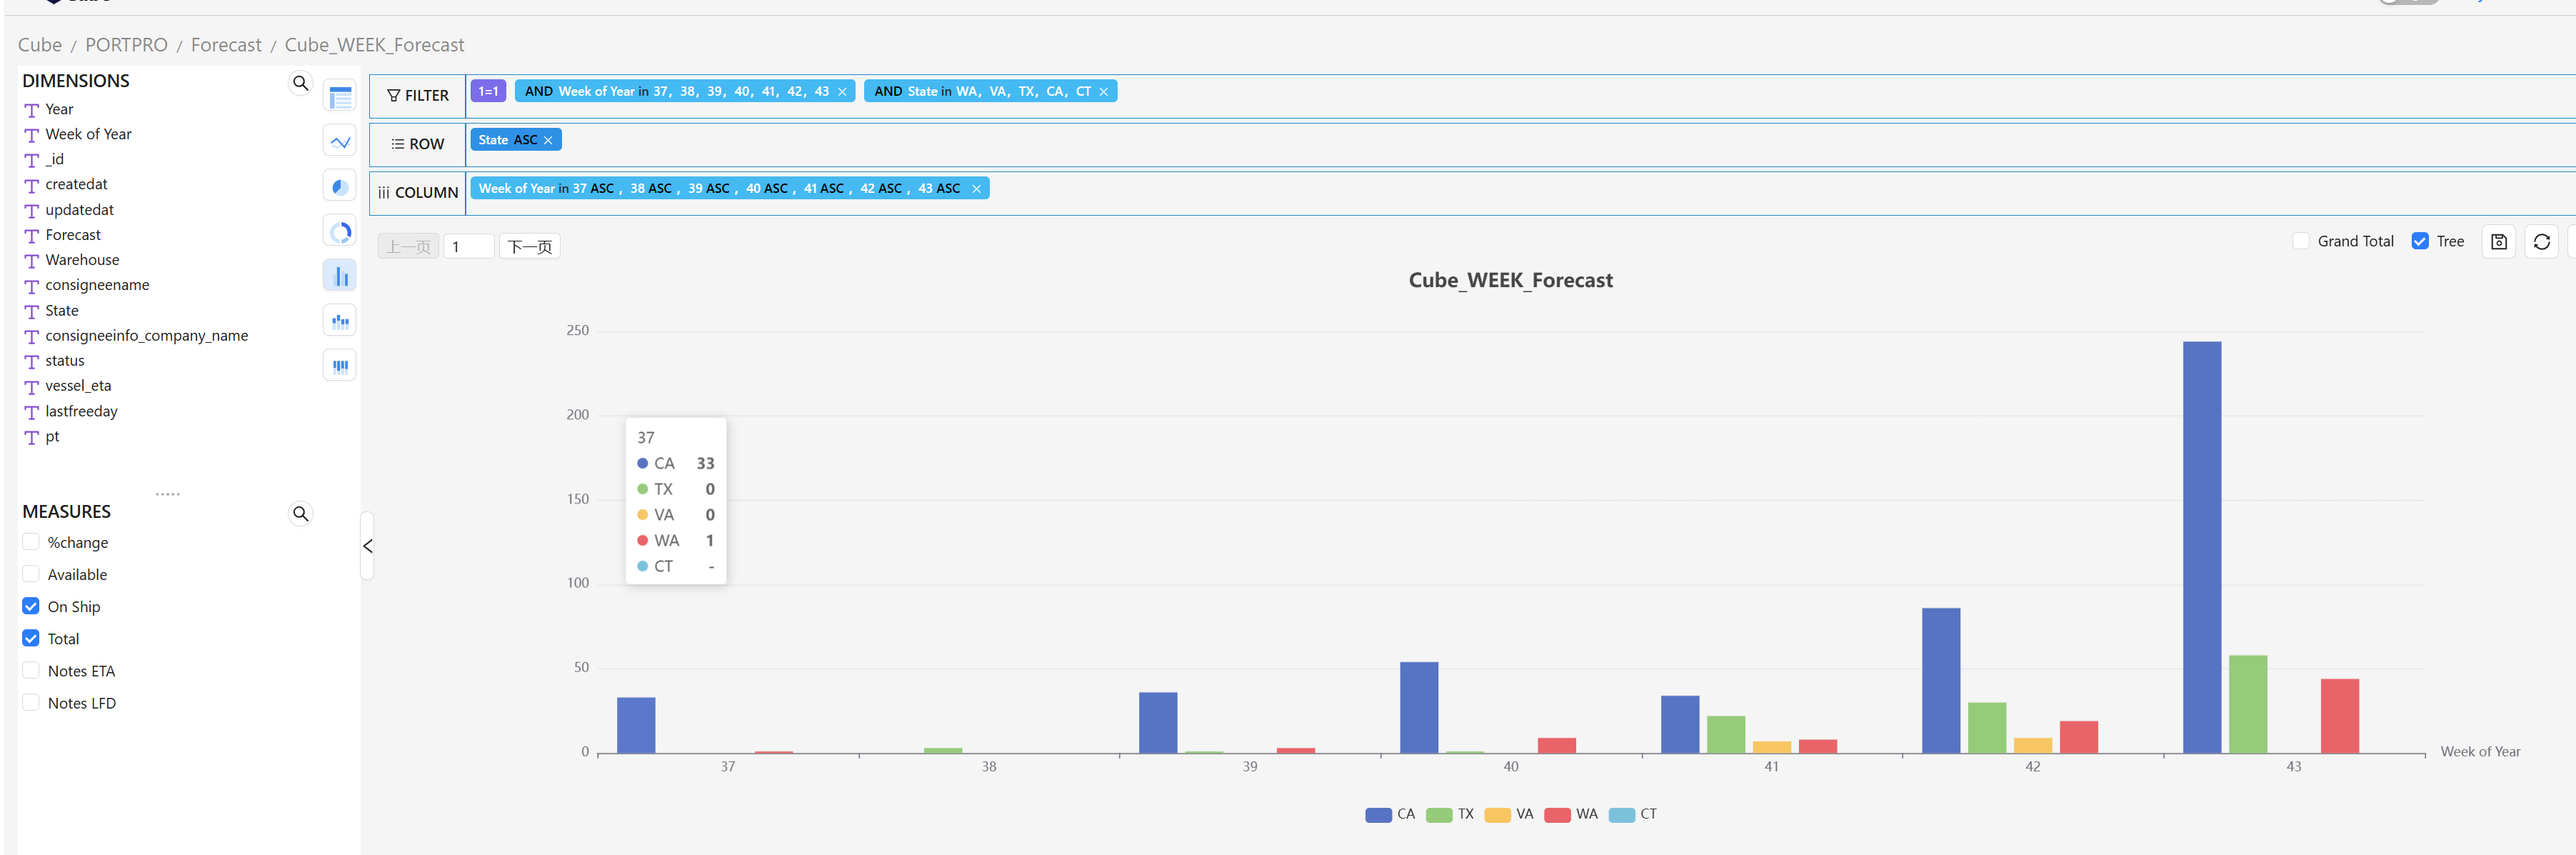
A bar chart uses vertical bars to represent data quantities. Each bar represents a category, with bar height indicating the value. Ideal for comparing different categories.
Bar generation follows the same rules as line charts. In a standard bar chart, different ROW values are displayed side by side on the horizontal axis.
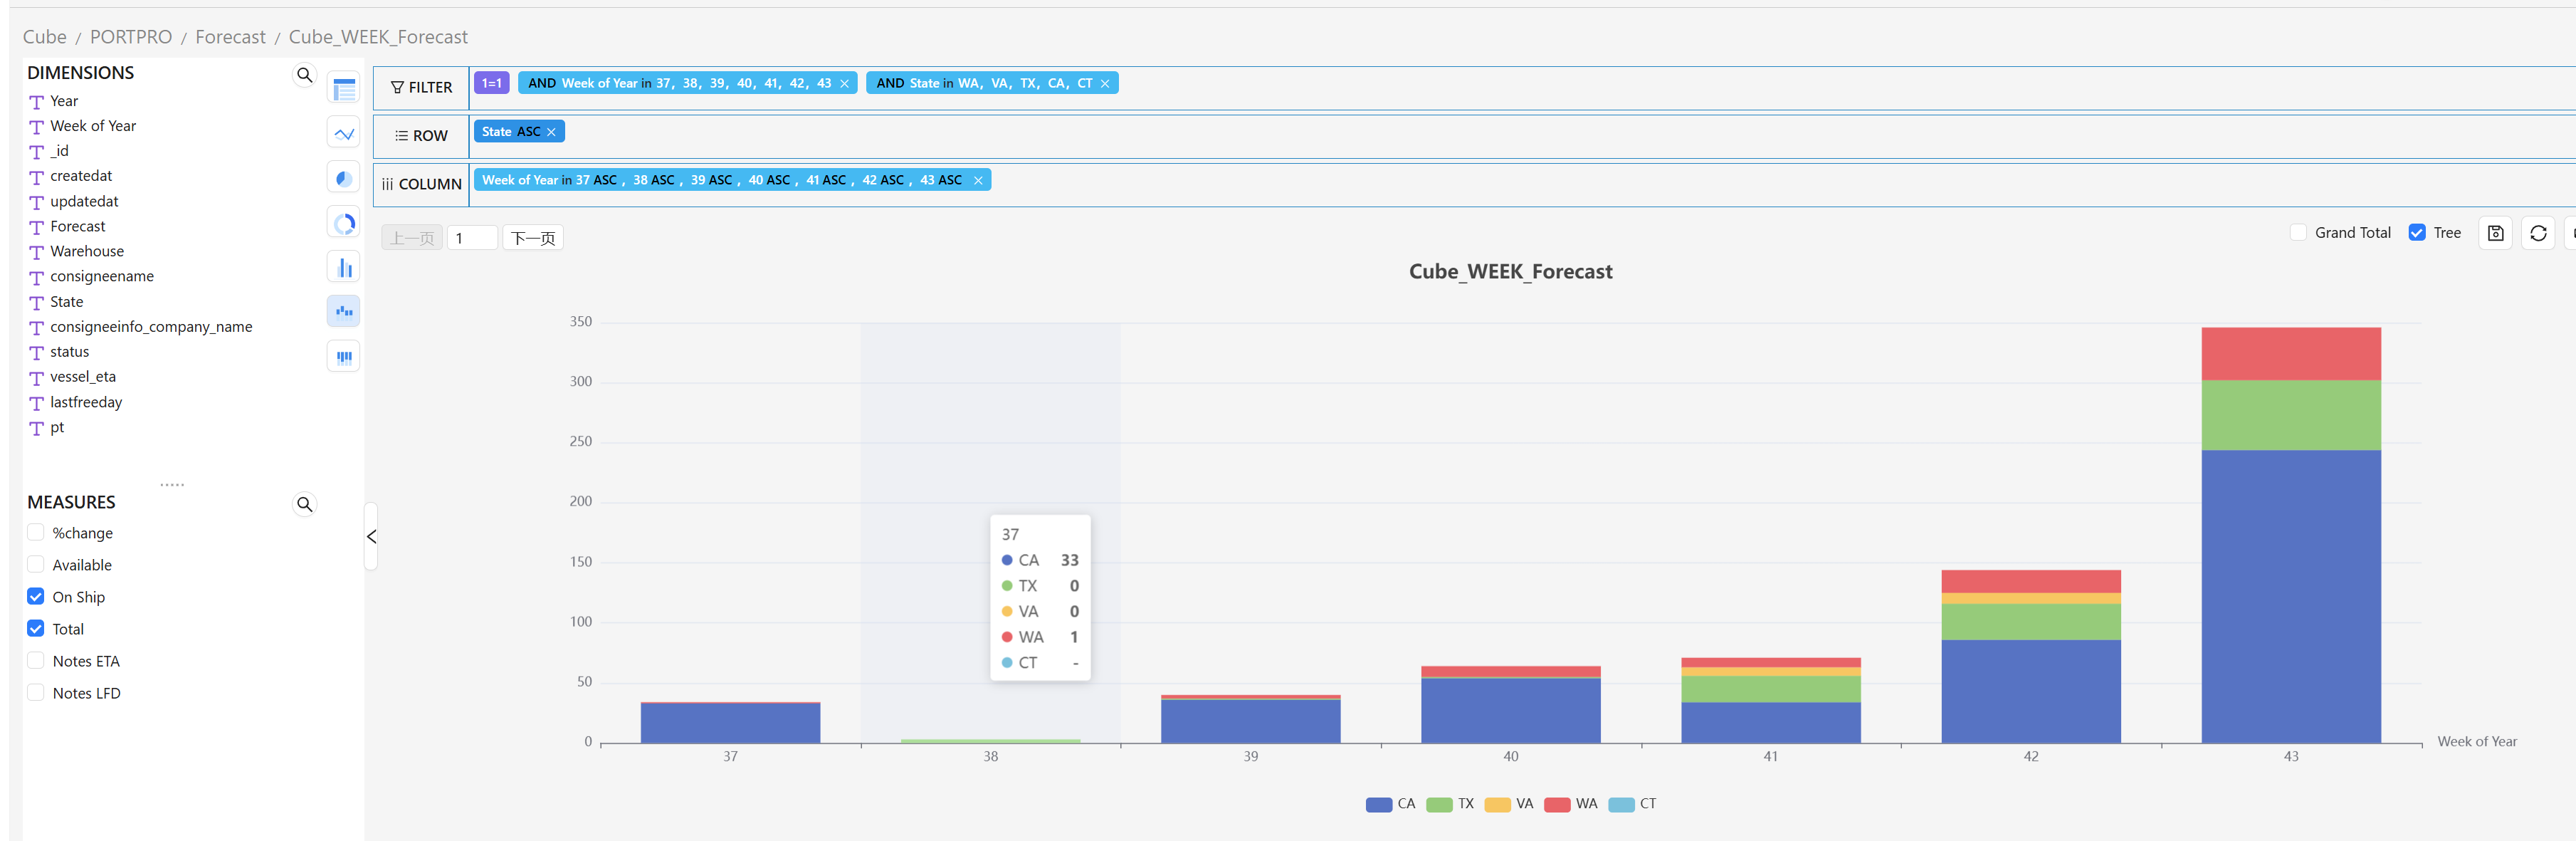
Stacked Bar Chart
A stacked bar chart divides each bar into multiple stacked segments, each representing a sub-category. Ideal for showing how data is distributed across categories and comparing sub-category totals.
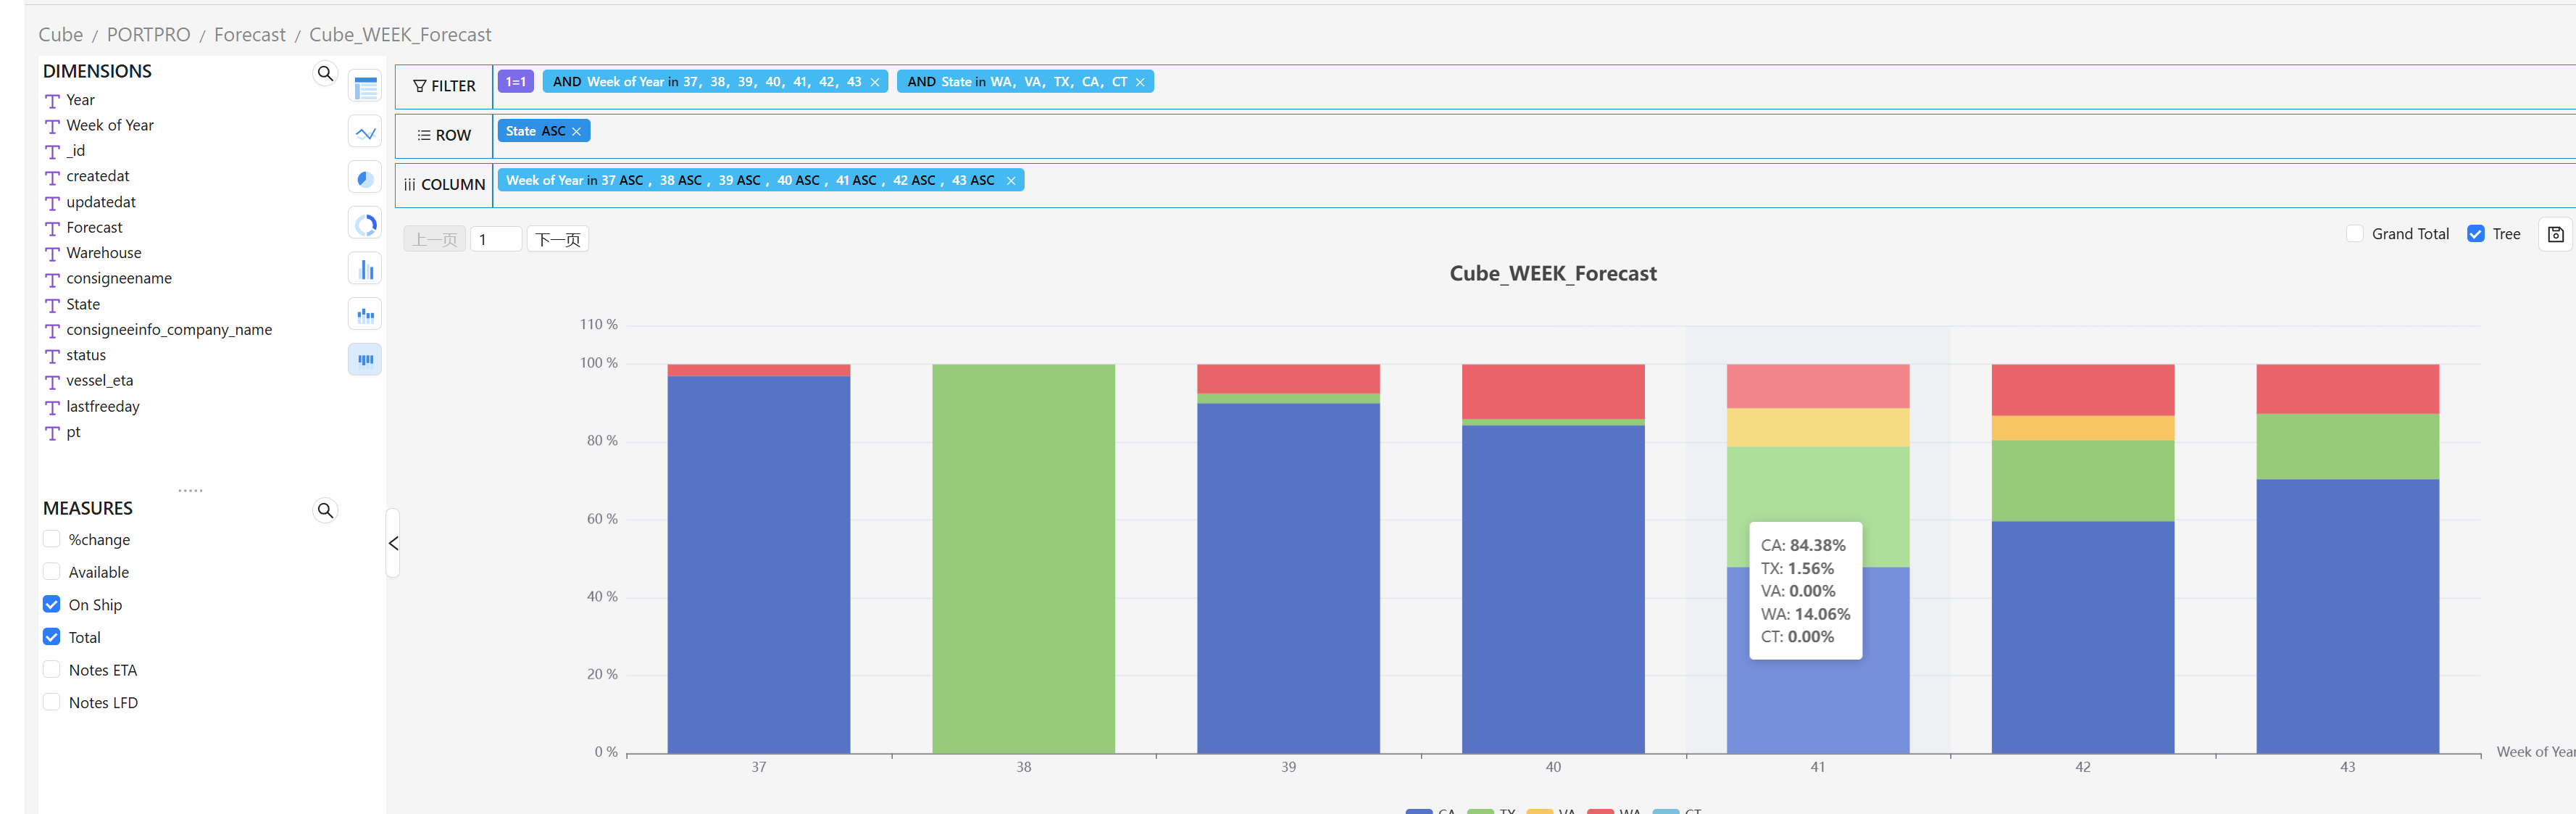
Percentage Stacked Bar Chart
A percentage stacked bar chart shows each category's proportion as a percentage of the total, with all bars summing to 100%. Useful for comparing relative proportions across groups or time periods.
Grid
Detail View
Do not select any measures — drag the fields you need into ROW to display detailed data.
Pivot View
Drag fields into ROW and COLUMN, select enum values in COLUMN, and check MEASURES to display aggregated pivot data.
Note: COLUMN must have specific values selected — dragging a field there without selecting values will not work.
Pagination
Up to 20,000 rows are displayed per page. Results exceeding this limit are paginated.
Grand Total
When checked, displays a grand total row at the bottom of each column.
Tree
When checked, data is displayed in a tree structure.
Save
Saves the current view as a report.
Editing a saved report will redirect you to the Cube page. If the Report ID changes, clicking Save creates a new report; otherwise, it updates the existing one.
Refresh
Reloads the current page.
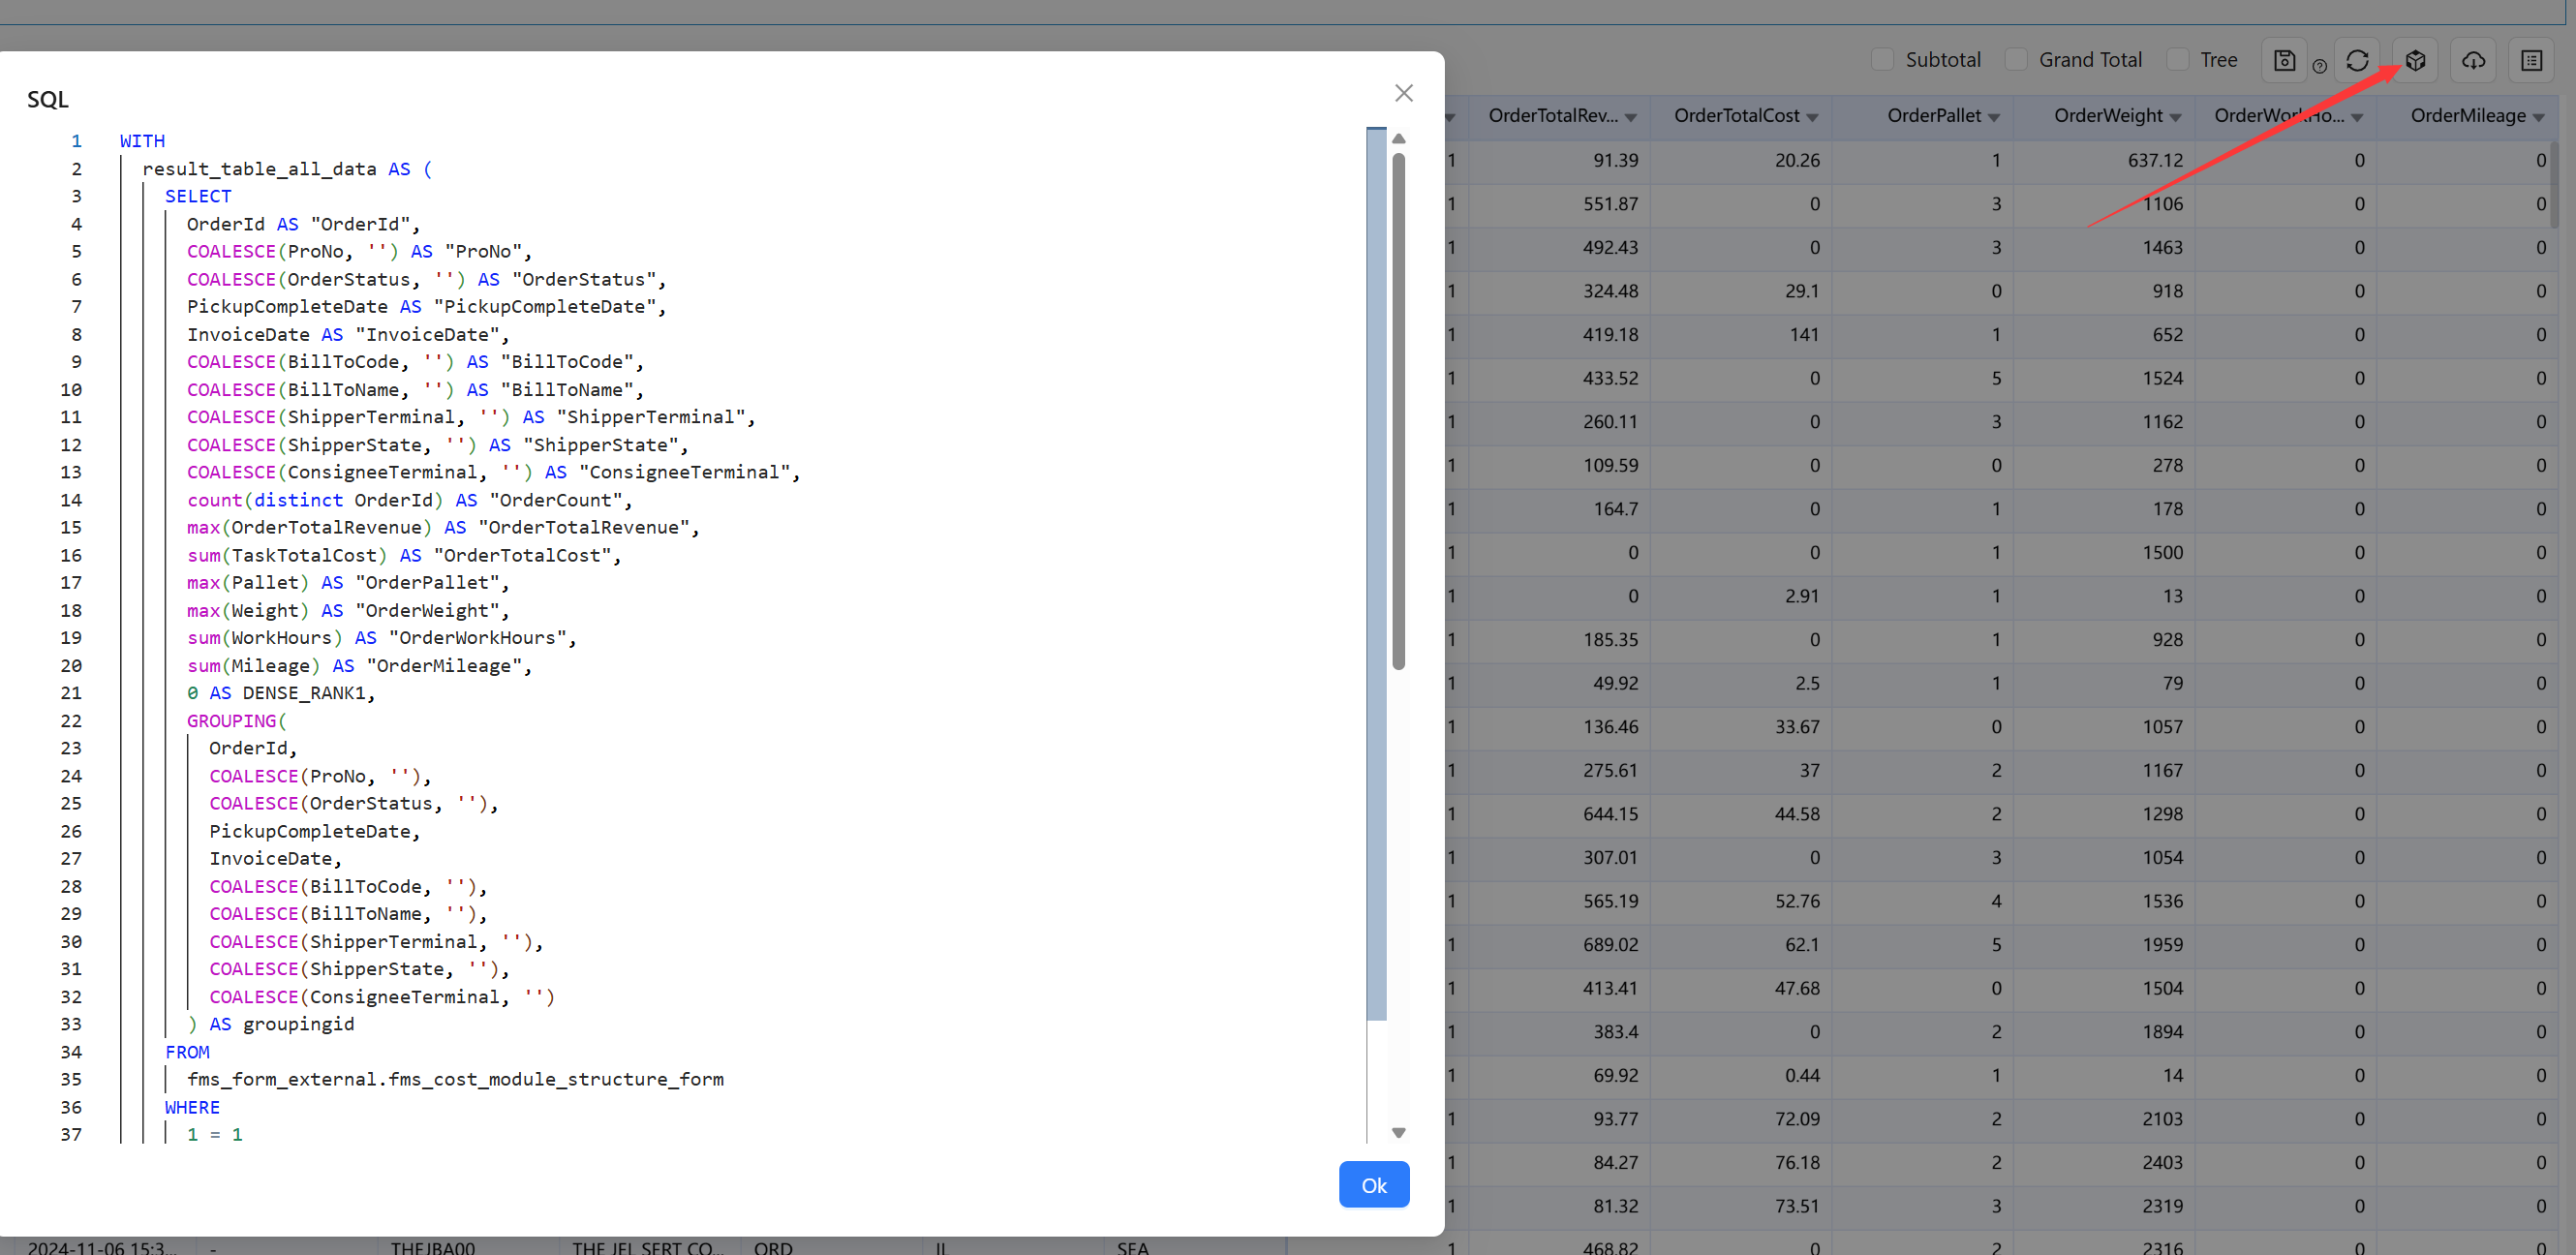
Show SQL
Displays the SQL statement generated by the current view configuration.
Download
Download as XLSX
Up to 20,000 rows.
Download as CSV
Up to 1,000,000 rows.
Cube Query Save to Redash
Save your Cube query directly as a Redash query for further use.
1. Select a Cube and Click View
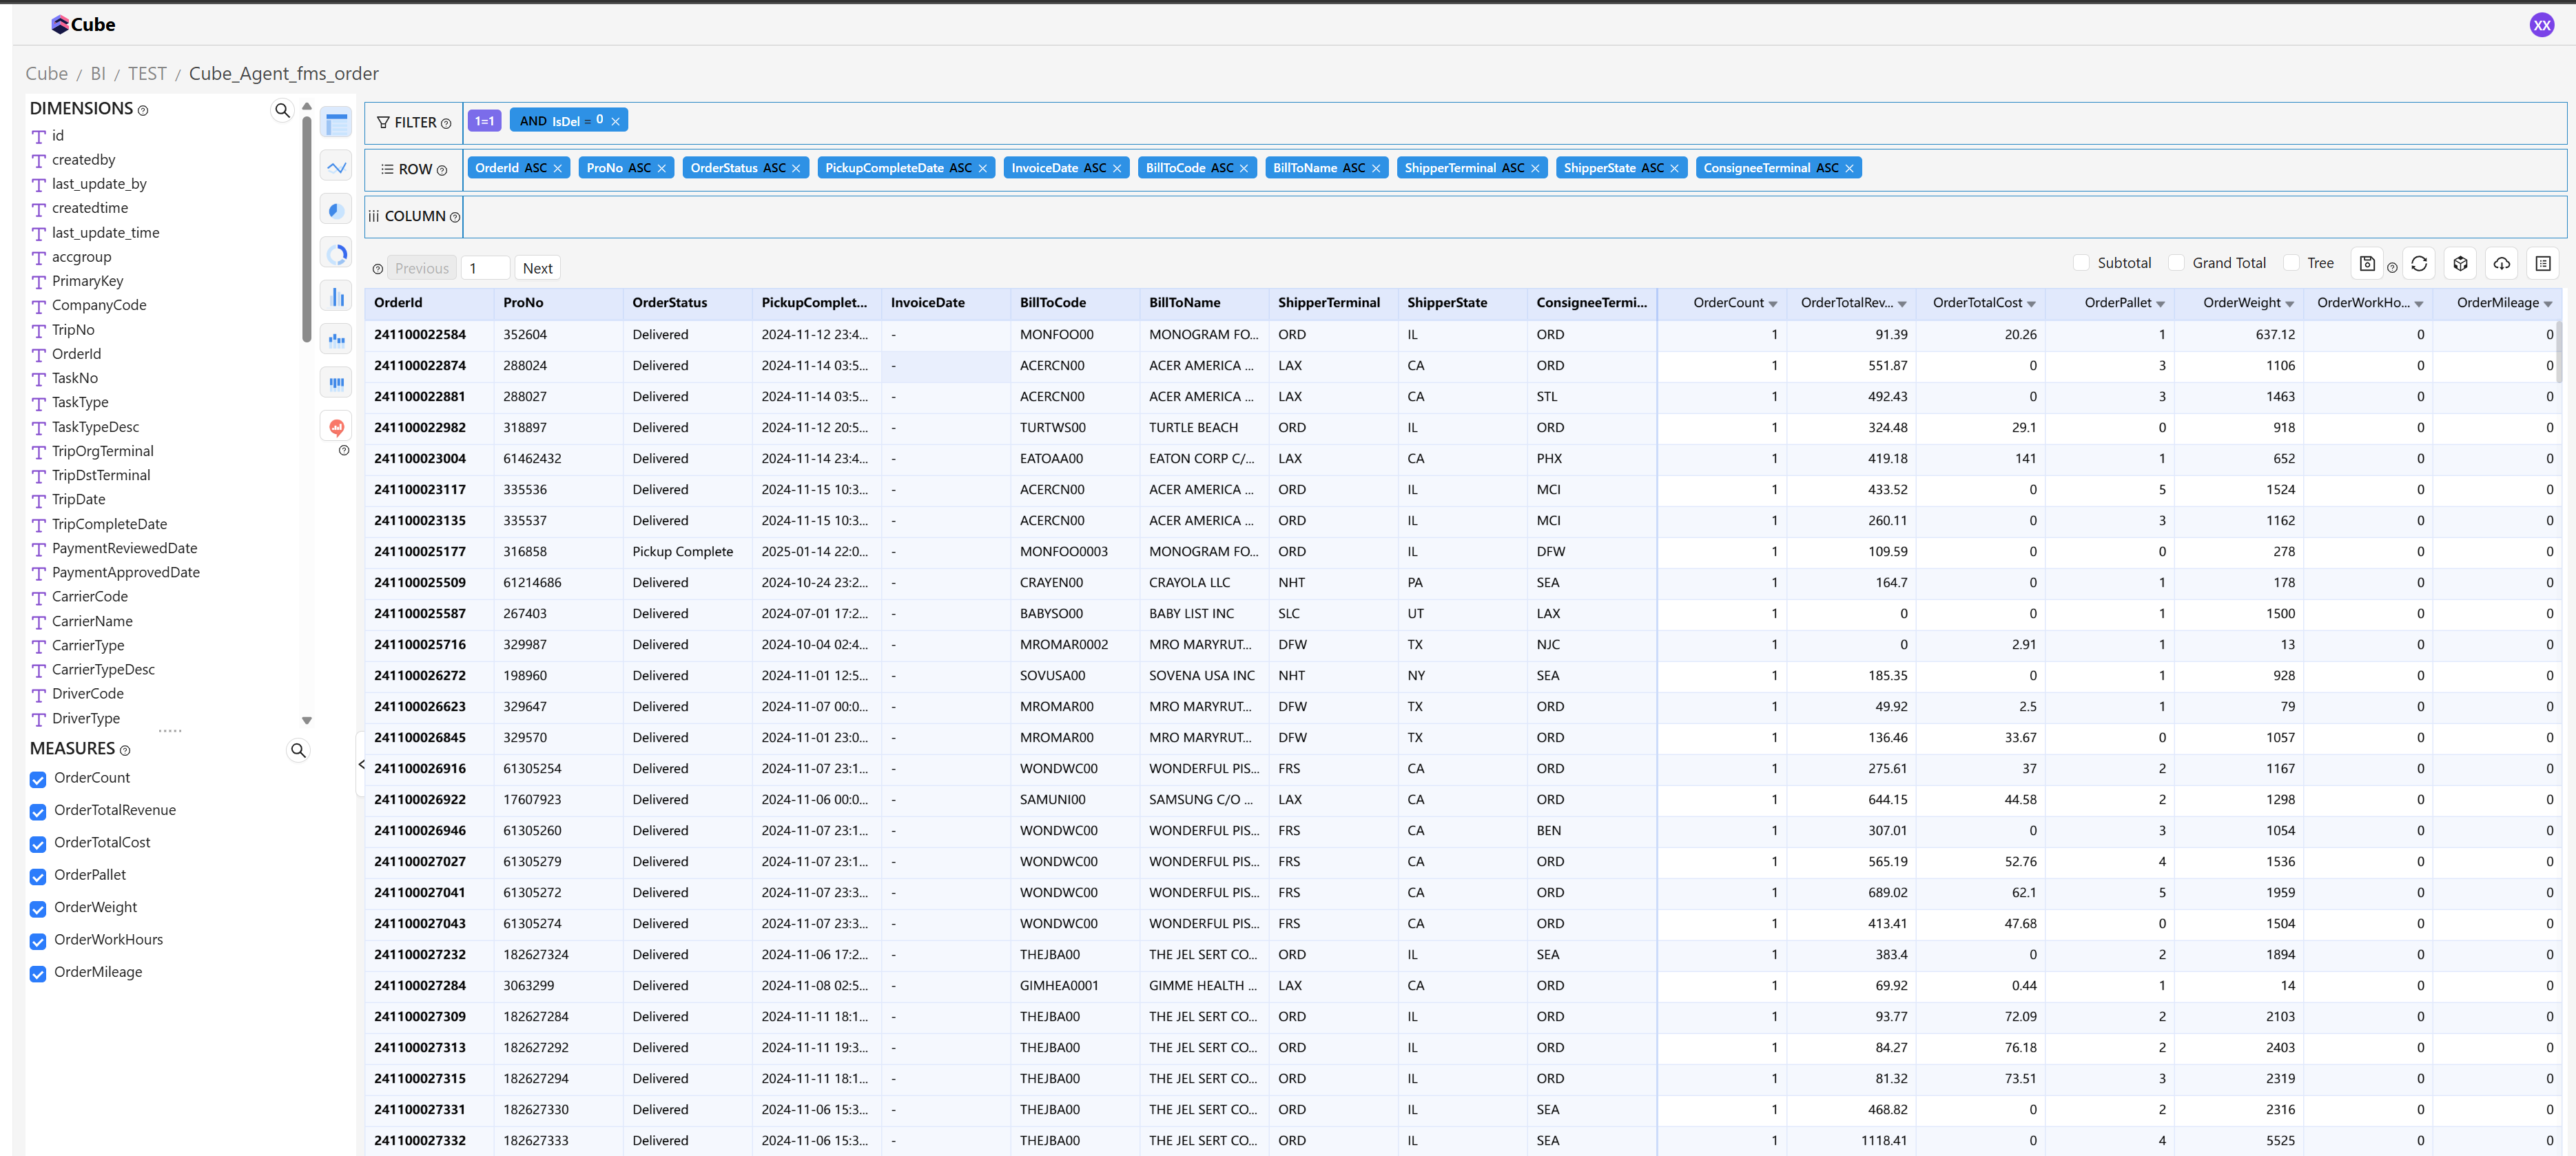
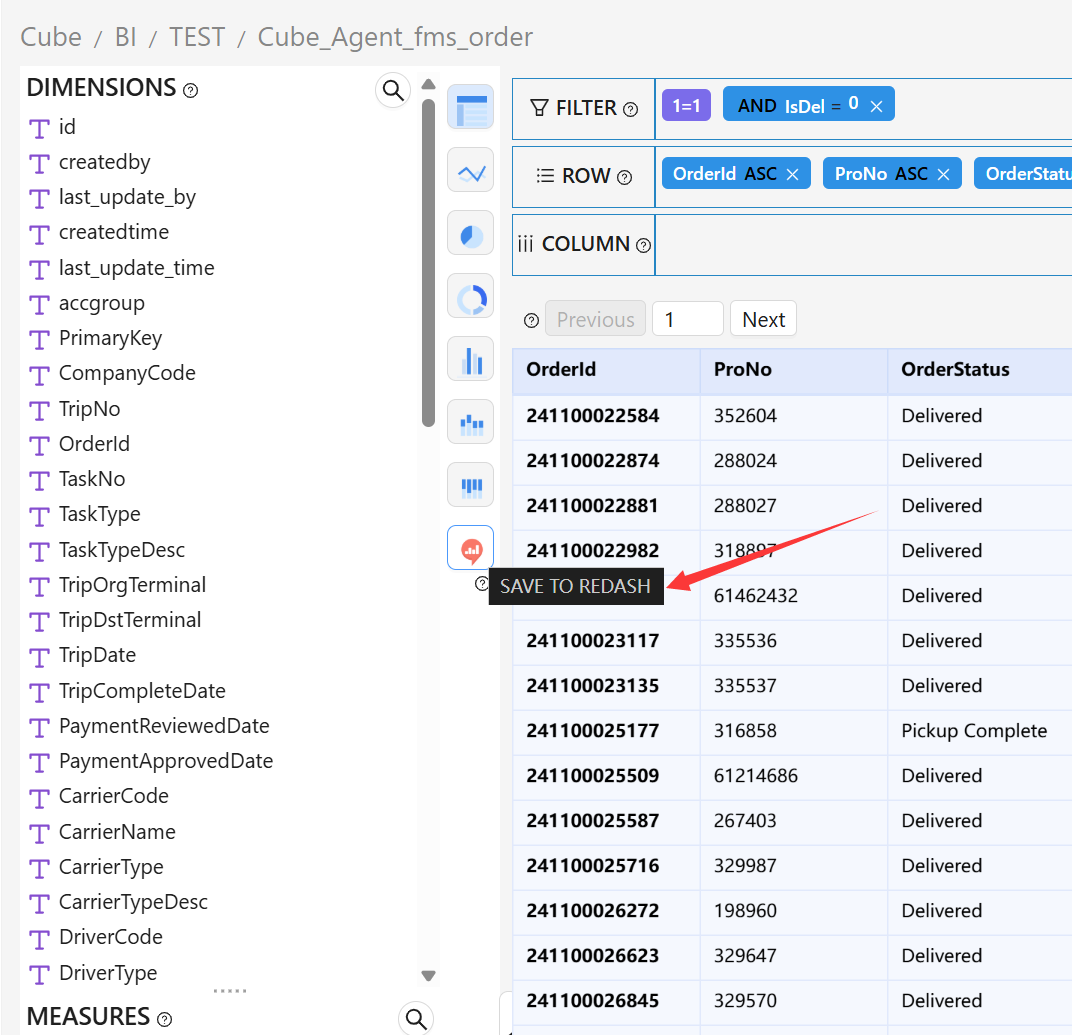
2. Save as Redash Query
There are two entry points to save as a Redash query:

After clicking Save, a dialog appears. Enter a custom query name and select tags (if the tag does not exist, it will be created automatically). Multiple tags can be selected.
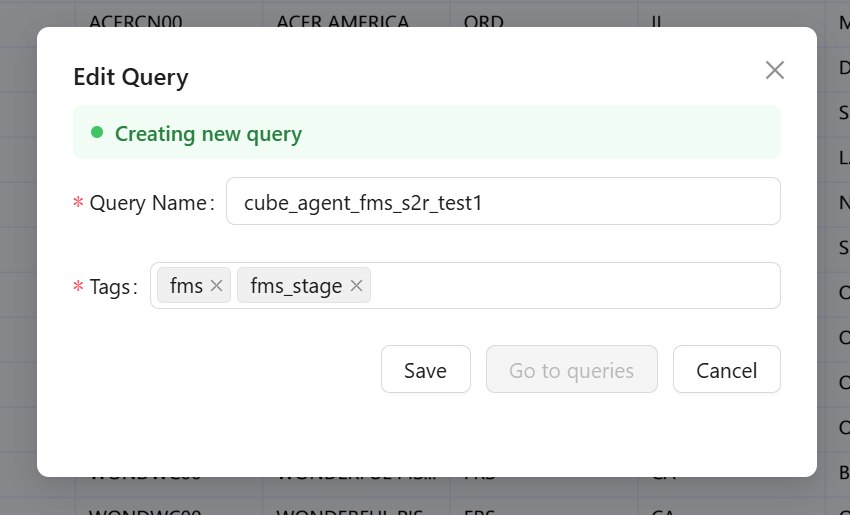
Click Save to confirm. Then click Go to Queries to jump to Redash.
The SQL saved in Redash will be identical to the SQL in Cube.
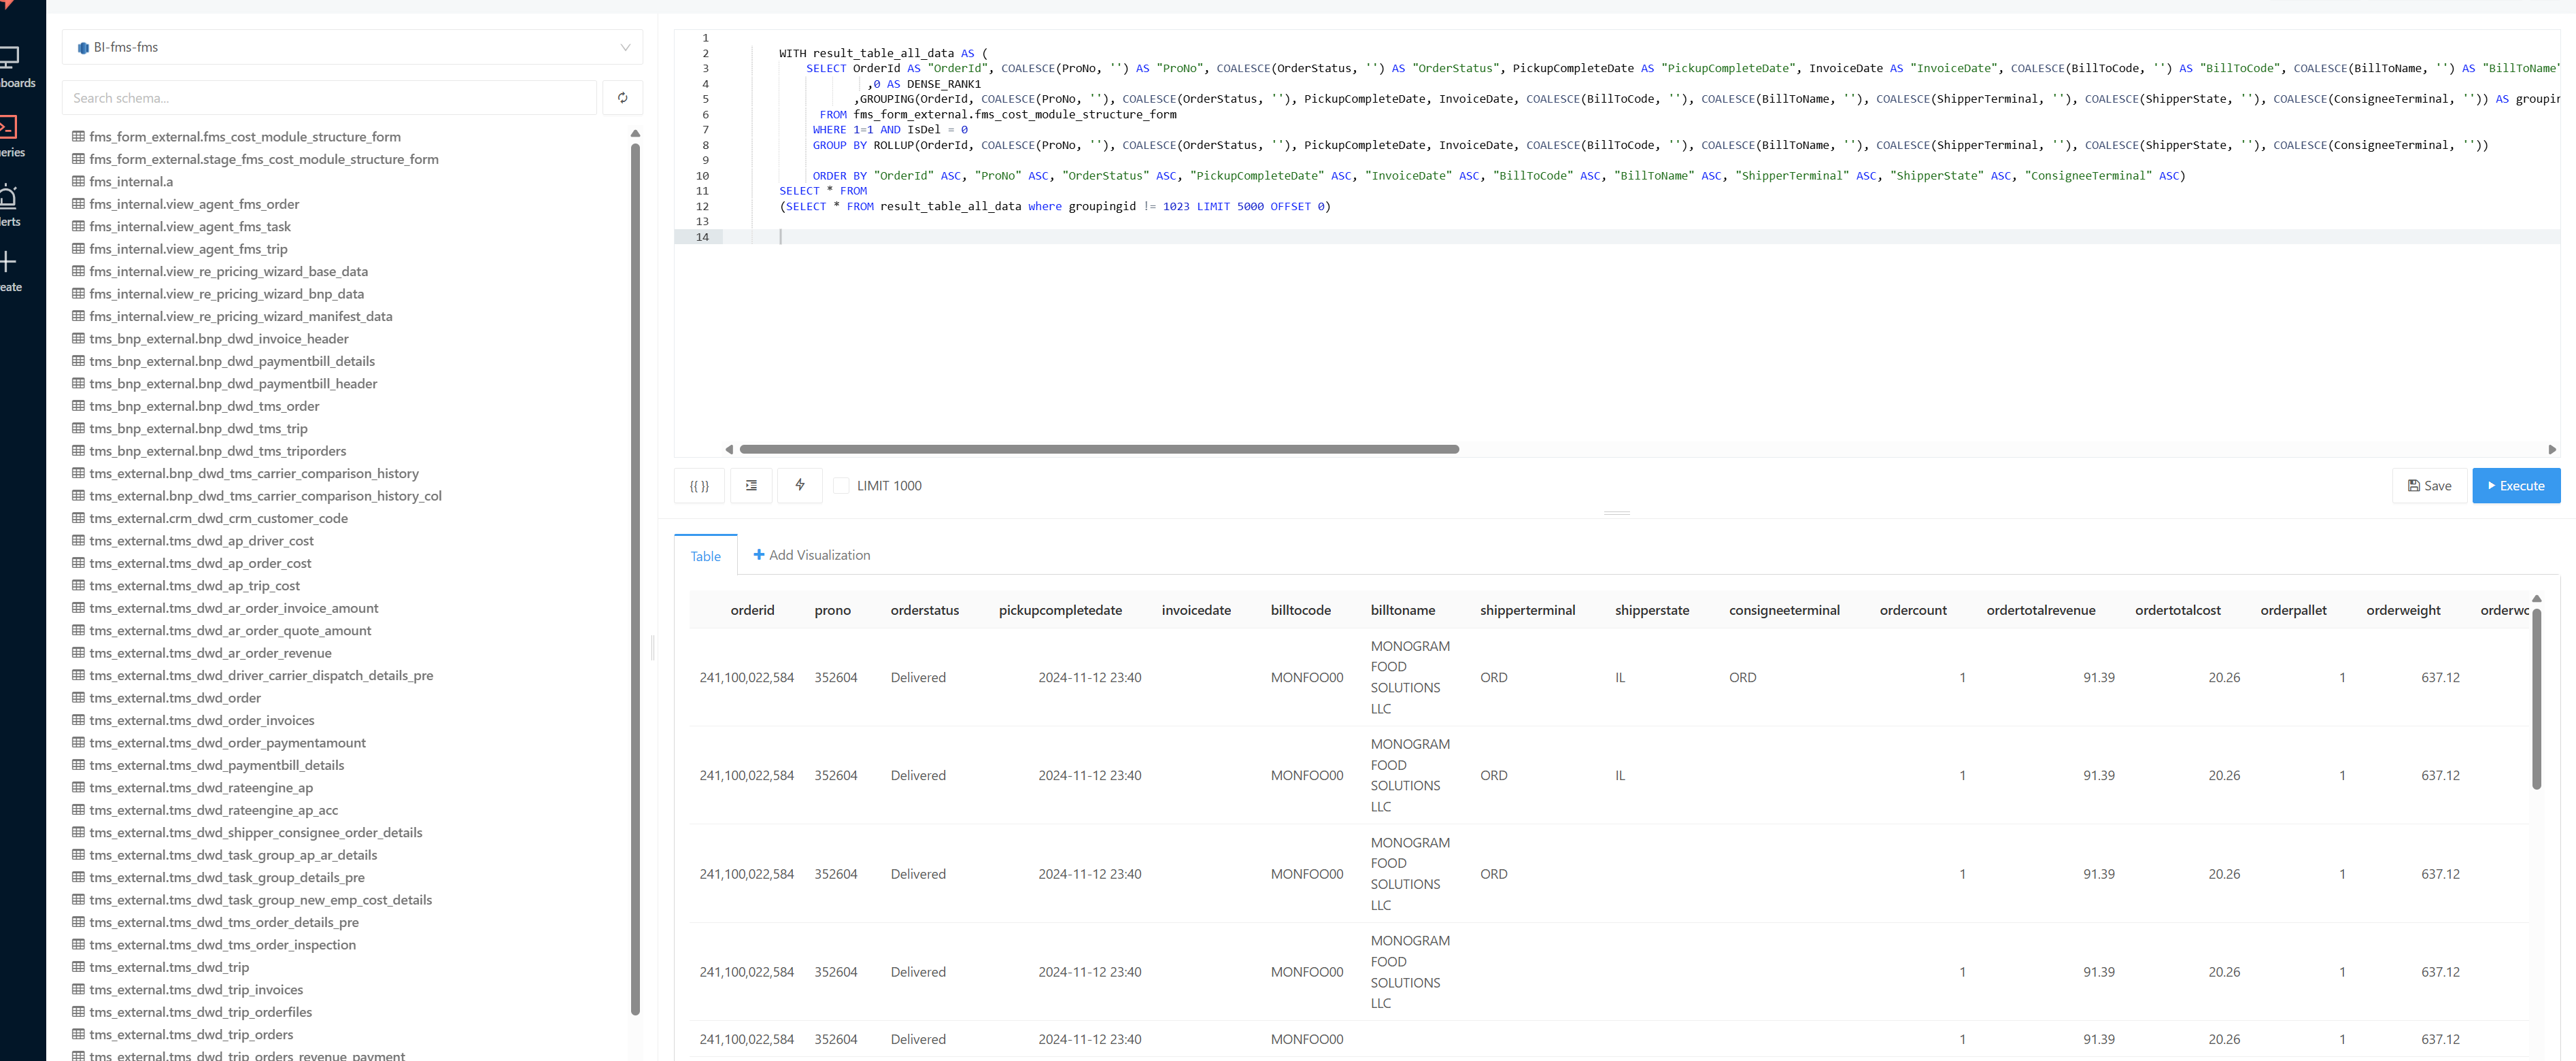
3. Saving Multiple Redash Queries from the Same Cube
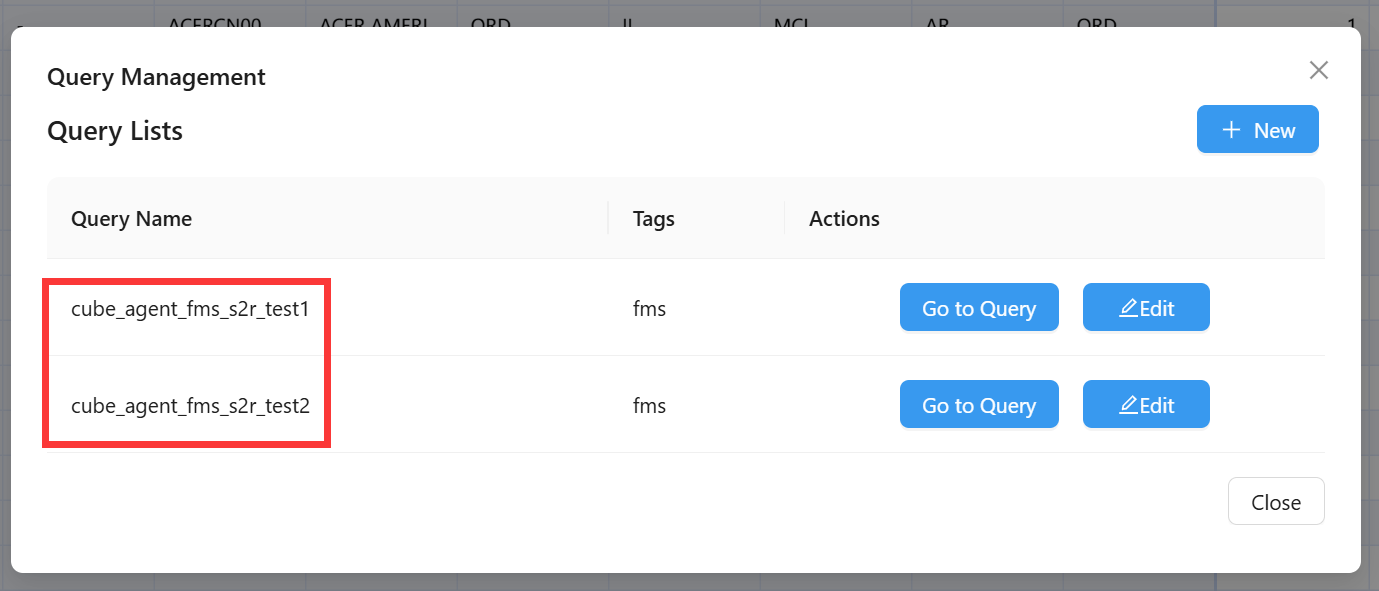
If a cube already has saved queries, clicking Save to Redash will automatically display a list of existing queries.
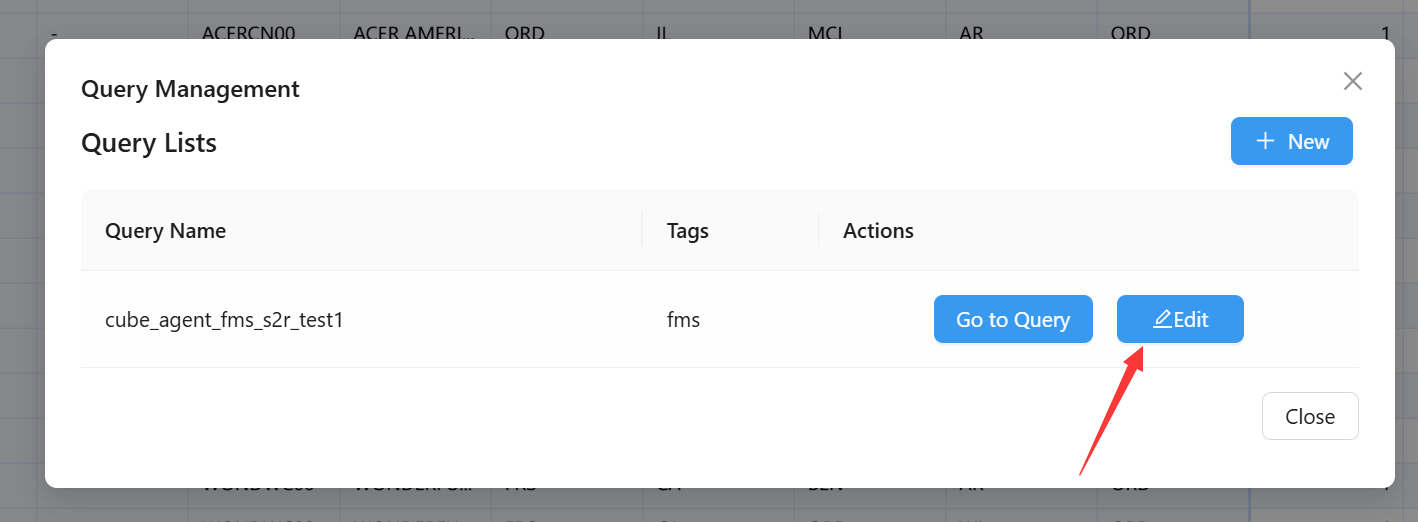
- Click Edit to modify the query name and tags of a selected query.
- Click Go to Query to navigate to that query in Redash.
- Click New to create a new query, which will also appear in the list.